Primates of the states
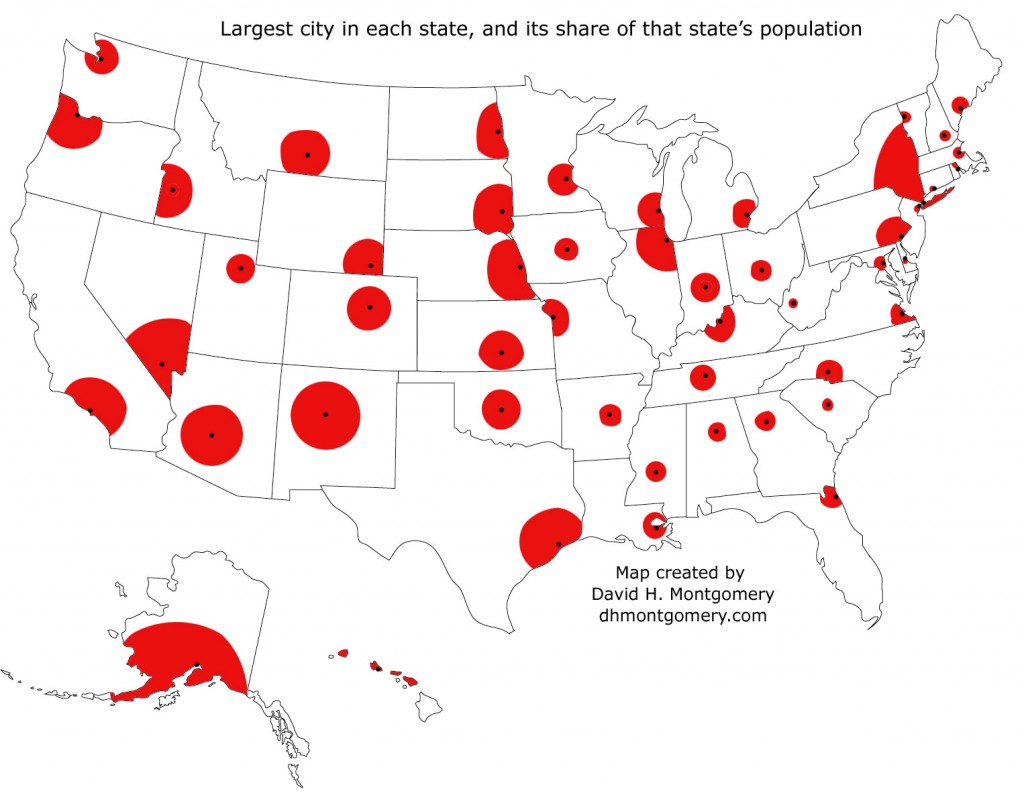 The approximate location of each state’s largest biggest city, which each state shaded to reflect what percentage of its population lives in that city (as a percentage of the total pixels in the state’s area on this particular map). The map can be a little misleading — the same percentage in a bigger state will take up more area. So while the New York and Texas circles are about the same absolute size, New York’s represents 42.95 percent of the state’s pixels, while Texas’ occupies just 8.29 percent of its. (More or less — I had to select the pixels by hand, so in most cases there’s a little error in one direction or another.)
When most people think of Louisiana, they think of New Orleans, its most prominent city. But that might irk a typical Louisianan, who’s likely to live well outside the Big Easy. Only 350,000 people call New Orleans home, less than 8 percent of the state and not much more than the capital Baton Rouge.
In contrast, my current state of South Dakota evokes images of endless fields of prairie and farmland. But almost 20 percent of the Mount Rushmore State lives in the fast-growing city of Sioux Falls, a percentage point behind Chicago’s relation to Illinois.
Other states aren’t associated with a single city at all. Missouri is divided between St. Louis and Kansas City. The two biggest cities in Minnesota are so entwined they’re usually referred to by a joint name. And Alabama has not two queen cities but four: Birmingham, Montgomery, Mobile and Huntsville all have around the same population, and each is around twice as populated as any other city in the state.
These facts aren’t just idle curiosities. They reflect important principles in math, statistics and demography, laws of nature most of us follow unawares — or break just as obliviously.
Whether a dense urban area or a rural one, any state or country will tend to have a small number of very large cities and a large number of small towns. It’s a principle called the “power law,” and it shows up in a lot more than just cities. In languages, a few words like “the” are used a lot, while large numbers of words are never used at all. Similarly, in books, music and movies, a few hits get consumed by everyone, while the so-called “long tail” of more obscure works have just a few customers each. Scholars have even discovered that war casualties follow a power law — there’s only a small number of bloodbaths like World War II, but large numbers of little skirmishes and insurgencies that don’t even crack the front pages.
If you graph something that follows a power law, it will have an L-shape, with a spike at one side that drops sharply, then gently declines in a long tail:

But if you graph it over a logarithmic scale — such as 1, 10, 100, 1,000, 10,000, etc., where values rise exponentially with every tick — a power law distribution will instead resemble a straight line:
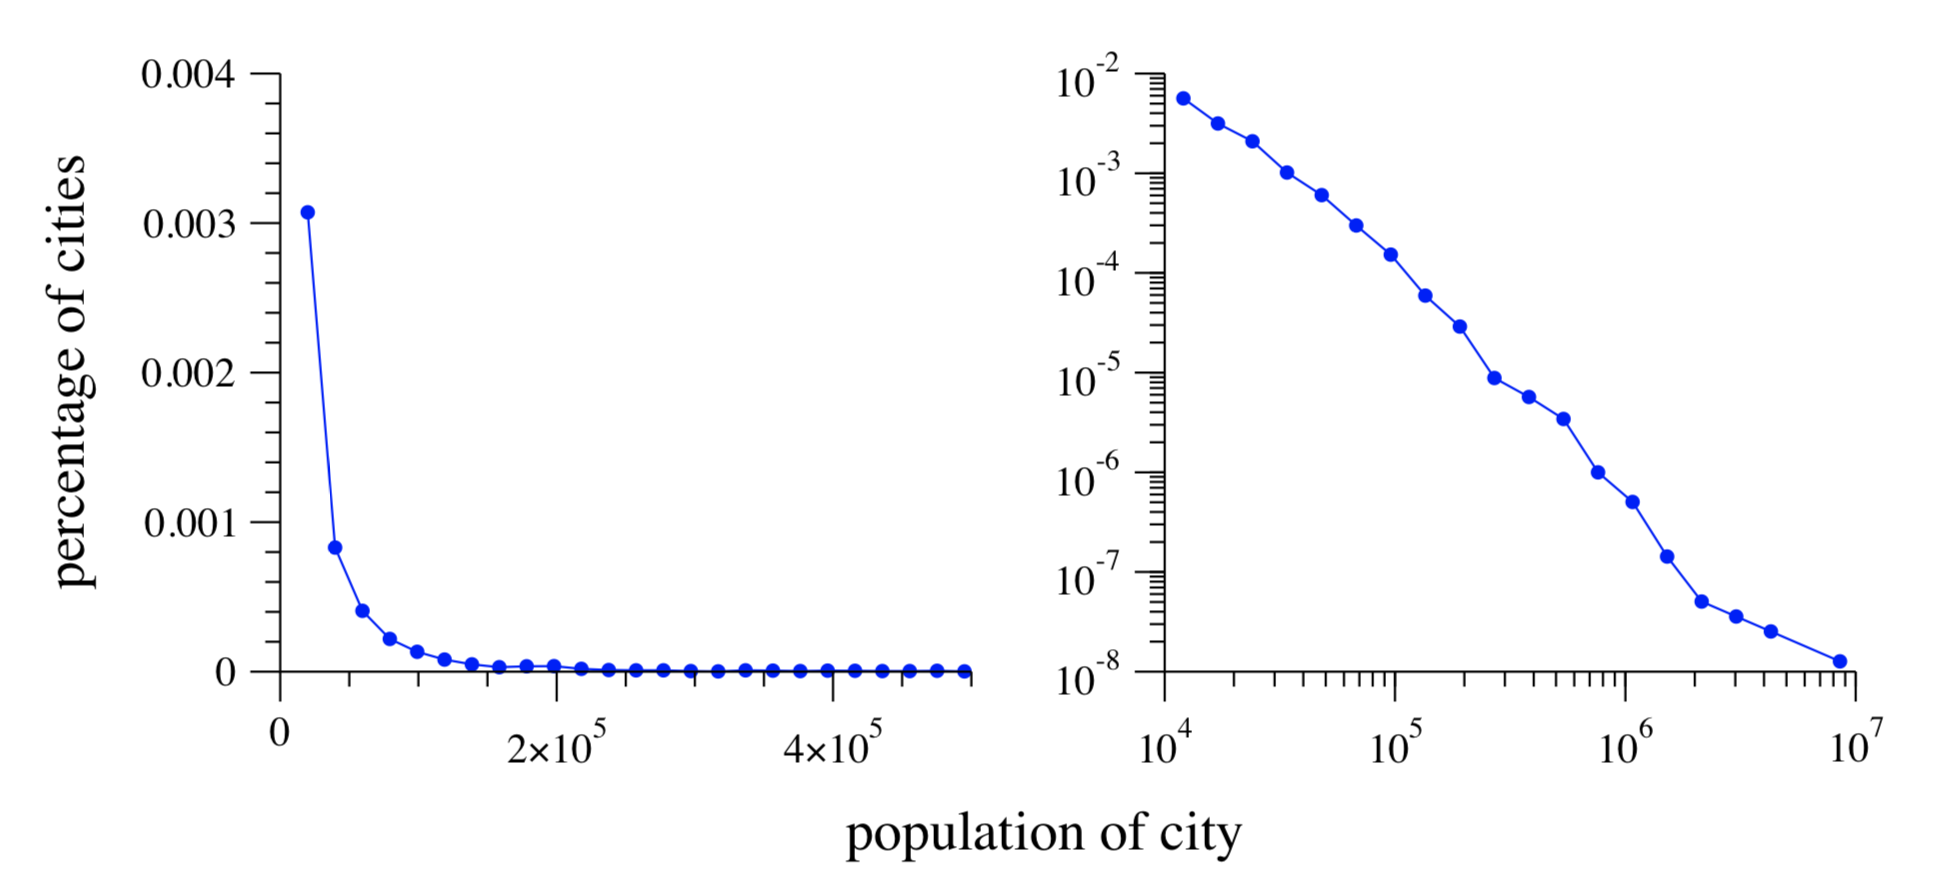 Graph from M. E. J. Newman. 2005. “Power laws, Pareto distributions and Zipf’s law.” Contemporary Physics, 46, 323-51.
(Not everything follows the power law — for example, average heights for men or women follows a “normal” distribution, with a lot of people near the average and smaller numbers on both sides. Both the power law and the normal distribution are examples of different ways numbers can cluster.)
But here’s the catch: the power law can be broken, even to things where it normally applies. There are other forces at work besides this tendency of some occurrences to involve a few big things and lots of little things. For example, while city size generally follows a power law, some countries have one city that’s disproportionately larger than the rest. A classic example is Paris, France’s cultural, political, economic and demographic center of gravity. If France followed the power law, Paris would still be the biggest city, but Marseilles or Lyons would be relatively larger and more powerful, a rival center of power and influence in the country instead of being on the country’s periphery. (Compare France to Italy, where Rome is big and important, but so is the business capital of Milan.)
Cities like Paris are called “primate cities” because they dominate their countries. The term, as coined by Mark Jefferson in 1939, just refers to cities that are “at least twice as large as the next largest city and more than twice as significant,” though its application can be somewhat subjective.
Most of the research on primate cities has happened at the national level, but the same logic can apply at a regional or sub-national level. New York City, the U.S.’s largest, isn’t a primate city for the whole country (despite the opinions of its residents). But no one can deny the dominance NYC exerts over its home state, 40 percent of whose population resides there. And that’s not even counting the influence of the Big Apple in parts of New Jersey and Connecticut.
I used data on city populations in each state to look at the role of each state’s largest city and how it relates to both the second-largest city and the rest of the state.
This ranges from New York, where NYC is 32 times larger than second-banana Buffalo, to Alabama, where the 212,000 people in Birmingham only slightly outnumber the 206,000 in Montgomery. As a percentage of the population, New York City and Anchorage, Alaska, both have more than 40 percent of their states’ populations, while Columbia, South Carolina, and Charleston, West Virginia, have less than 3 percent of theirs despite being the largest in the state.
| Top five cities by share of state’s population: | Bottom five cities by share of state’s population: |
|---|---|
| 1. New York City, 42.95% of New York | 1. Charleston, 2.75% of West Virginia |
| 2. Anchorage, 40.82% of Alaska | 2. Columbia, 2.79% of South Carolina |
| 3. Honolulu, 28.06% of Hawaii | 3. Newark, 3.13% of New Jersey |
| 4. Albuquerque, 26.63% of New Mexico | 4. Bridgeport, 4.08% of Connecticut |
| 5. Omaha, 22.72% of Nebraska | 5. Jacksonville, 4.33% of Florida |
| Top five cities with the most people compared to the second-largest city in their state: | Bottom five cities with the most people compared to the second-largest city in their state: |
| 1. New York, New York, 32.41 times larger than Buffalo | 1. Birmingham, Alabama, 1.03 times larger than Montgomery |
| 2. Chicago, Illinois, 13.58 times larger than Aurora | 2. Charleston, West Virginia, 1.04 times larger than Huntington |
| 3. Anchorage, Alaska, 9.28 times larger than Juneau | 3. Columbia, South Carolina, 1.05 times larger than Charleston |
| 4. Honolulu, Hawaii, 9.03 times larger than Hilo | 4. Cheyenne, Wyoming, 1.06 times larger than Casper |
| 5. Baltimore, Maryland, 6.24 times larger than Columbia | 5. Memphis, Tennessee, 1.07 times larger than Nashville |
Get the rest of the lists here.
I looked only at official city size, recognizing the shortcomings of this approach. The true strength of many urban centers doesn’t stop at the legal boundary but encompasses the great masses of residents and businesses in surrounding suburbs. In this sense, looking at metropolitan areas would be a better bet. But many metropolitan areas, as defined by the U.S. Census, spill over into other states, creating too much messiness for a state-focused analysis.
But being a primate city – or not – is about more than just beating #2. It means being a truly dominant center of a state or country. In a normal power-law situation, the second-largest city will have half the population of the largest, while the third-largest will have one-third the people, and the fourth one-quarter, descending in inverse proportion to their rank.
So I pulled lists of the population of every city in each state from Wikipedia, and graphed them on a logarithmic scale. Remember that if something follows a power law, when graphed on a logarithmic scale it will appear to be a straight line.
That’s what we see looking at Missouri:
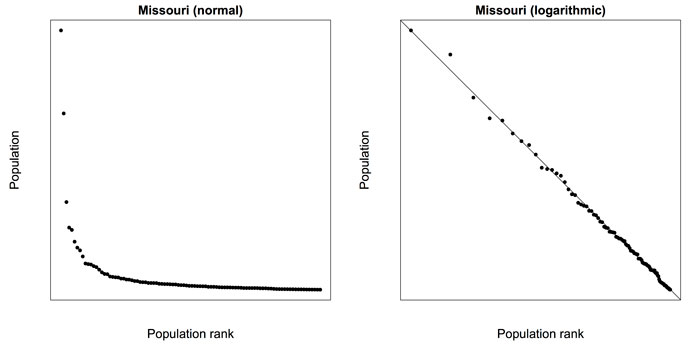 Graphs created by David H. Montgomery.
In contrast, Illinois displays a clear example of a primate city, with Chicago’s population far above the trend line evidenced by the rest of the state.
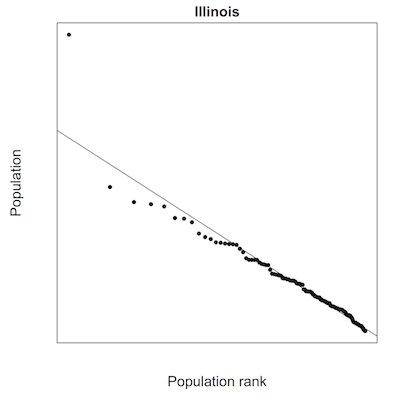
Other states don’t clearly fall into one category or another. Some have several big cities distinct from the general trend. Some have two cities near the top who also happen to be very near each other – both New Jersey and Minnesota reflect this situation. (Though New Jersey is probably better understood as being pulled between two different cities, neither one in its borders: New York City and Philadelphia.) In other cases, the two cities are far apart: Sioux Falls and Rapid City are on opposite sides of the state, as are Seattle and Spokane, and Philadelphia and Pittsburgh. In those cases, distance could mitigate the “primate city” effect, leaving the distant second city more as a distinct provincial capital than as runner-up.
The right end of each graph isn’t as important as the left – in many cases the linear trend breaks down on the right due to the large number of smaller cities, but research has shown smaller towns don’t follow the power law distribution as consistently as cities over 10,000 people do. Different states also had wildly varying sample sizes, ranging from hundreds of cities to less than two dozen. Also, the y-axis of each graph varies, with the top of the y-axis representing the population of the state’s largest city, whether that’s eight million or 42,000.
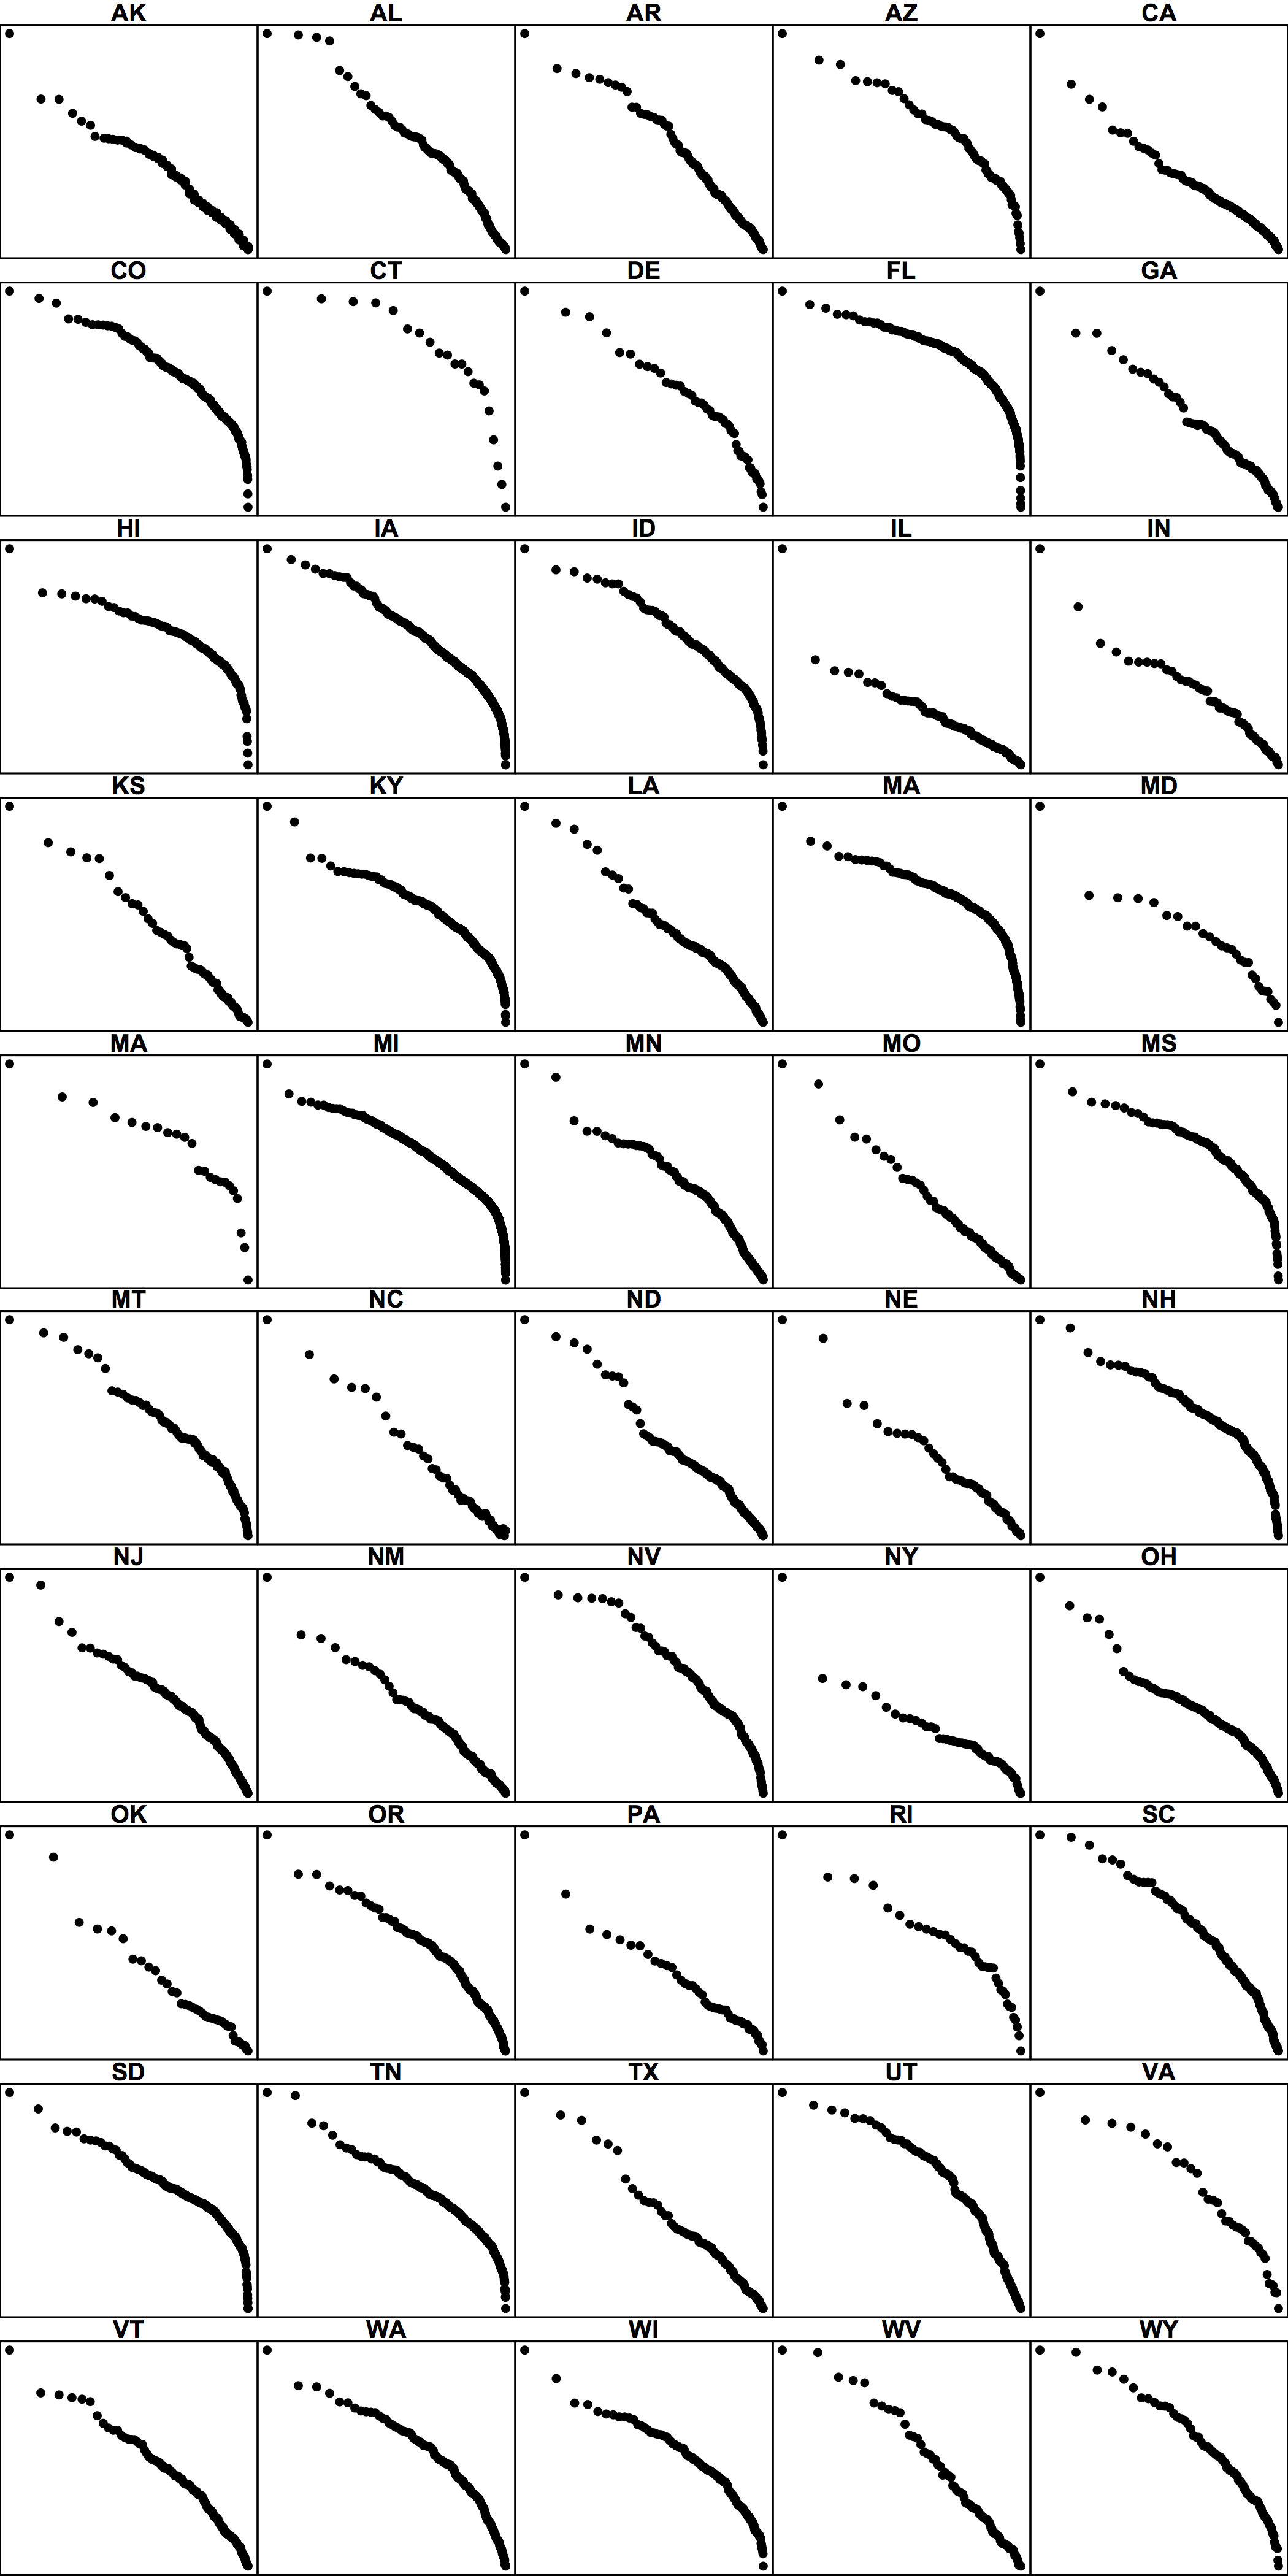 Graphs created by David H. Montgomery. Click to enlarge.
Download the data and code used to create this post here.