Hip to be square: American edition
Earlier this year, programmer David Barry released a fun estimation of how rectangular each country’s borders are.
Ignoring some outlying islands (and archipelago nations whose shape isn’t approximated by any shape) it turns out that between 60 and 95 percent of national borders fit within that blockiest of shapes.
 But many national boundaries have been set by things such as “coastlines” or “mountains” or “colonial compromises.” Much of the United States — especially west of the original 13 colonies — has been set by more geometric criteria, such as lines of latitude and longitude.1 (For more information, Mark Stein’s “How the States Got Their Shapes” is a quick, breezy read.)
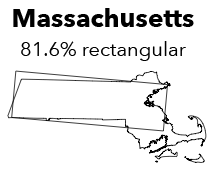
So I modified Barry’s code to estimate how well each state can be approximated by a rectangle. To score well, a rectangle has to include as much of the state’s land as possible — while excluding as much area outside the state as possible. (This account for why California, a sort of angled box shape, scores so poorly. You can easily draw a rectangle that takes in most of California — but you’ll also get a bunch of not-California in the rectangle, too.)
As it turns out, U.S. states ARE somewhat more rectangular than world countries. The median rectangularness index for countries in Barry’s estimations was 0.843 (on a scale from 0 to 1). The median U.S. state, by contrast, is 0.861. Setting aside Alaska (which the code just couldn’t handle), the range runs from Hawaii’s 0.581 to nearly perfect Wyoming, 0.999.
After the jump, view the data for yourself — plus keep scrolling for an even deeper dive into the rectangularness of U.S. counties.
| Rank | State | Index | Rectangle-ness |
|---|---|---|---|
| 50 | Hawaii | 0.581 | 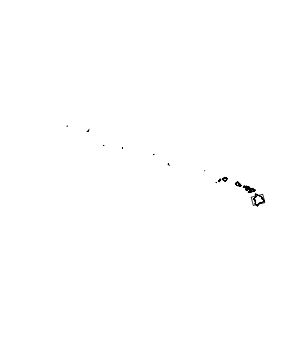 |
| 49 | California | 0.622 | 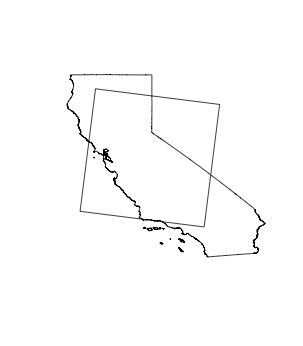 |
| 48 | Michigan | 0.699 | 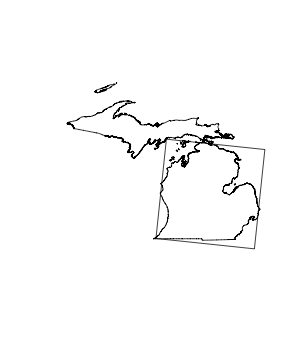 |
| 47 | Maryland | 0.715 | 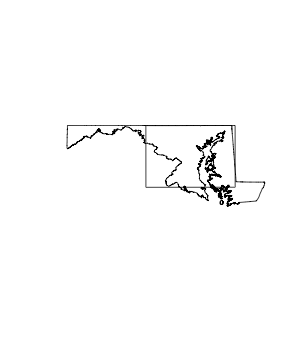 |
| 46 | New York | 0.761 | 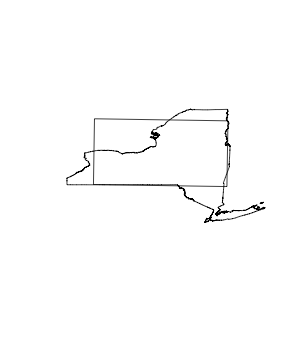 |
| 45 | Virginia | 0.767 | 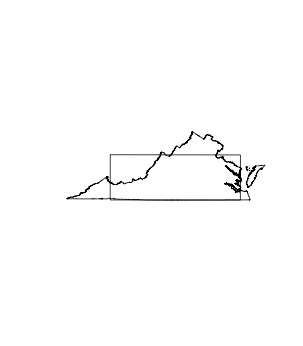 |
| 44 | Delaware | 0.768 | 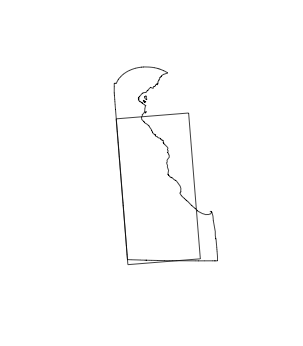 |
| 42 | Idaho | 0.778 | 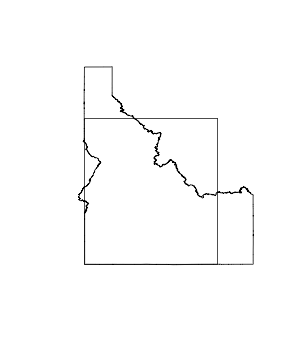 |
| 43 | Florida | 0.778 | 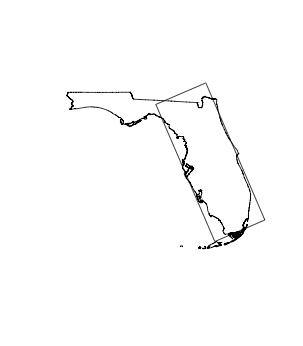 |
| 41 | Louisiana | 0.812 | 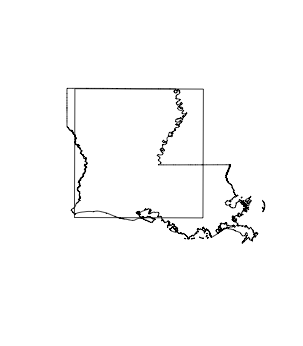 |
| 40 | Massachusetts | 0.816 | 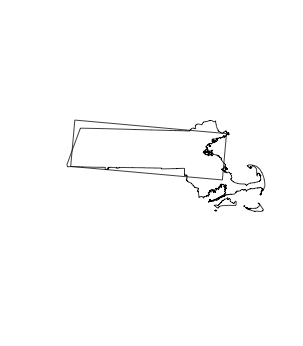 |
| 39 | North Carolina | 0.83 | 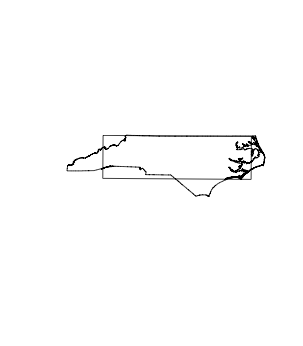 |
| 38 | New Hampshire | 0.837 | 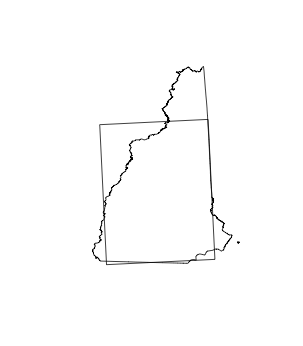 |
| 37 | Kentucky | 0.848 | 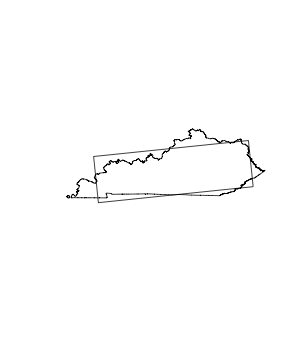 |
| 36 | South Carolina | 0.852 | 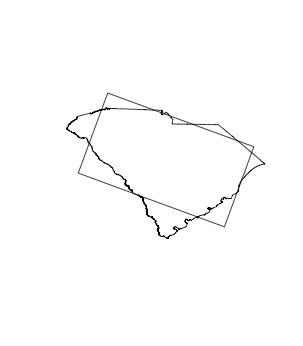 |
| 35 | Vermont | 0.854 | 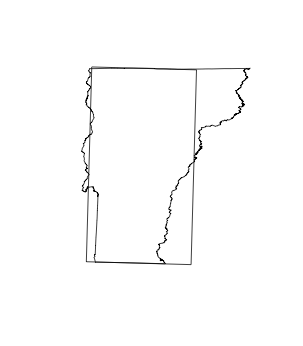 |
| 34 | Rhode Island | 0.855 | 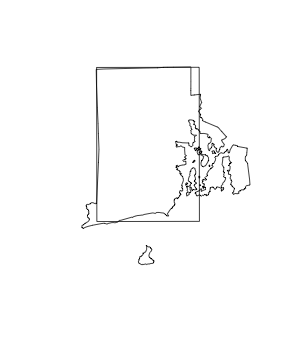 |
| 33 | West Virginia | 0.86 | 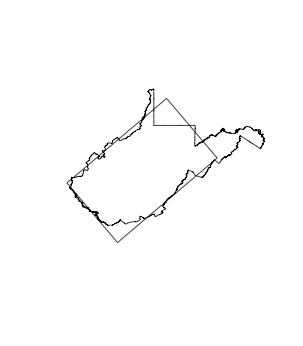 |
| 32 | New Jersey | 0.864 | 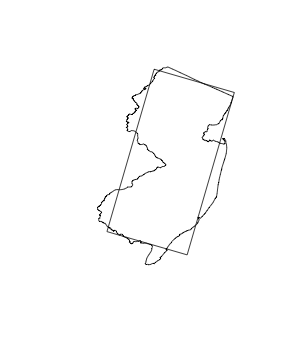 |
| 31 | Texas | 0.866 | 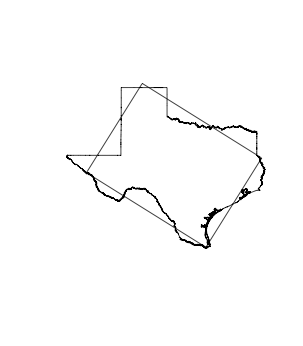 |
| 30 | Maine | 0.871 | 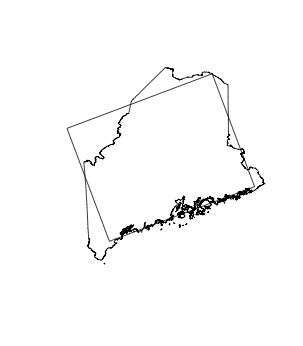 |
| 28 | Nevada | 0.884 | 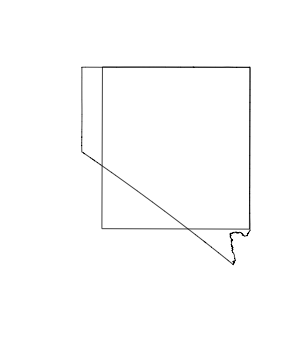 |
| 29 | Missouri | 0.884 | 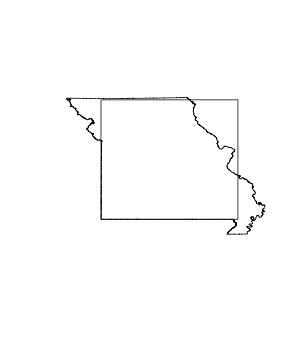 |
| 27 | Minnesota | 0.887 | 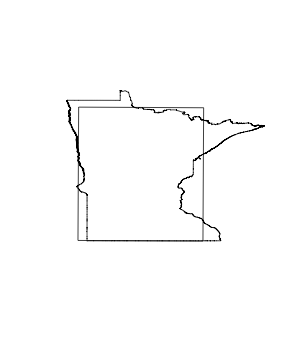 |
| 26 | Wisconsin | 0.888 | 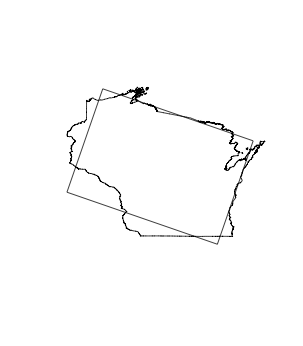 |
| 25 | Illinois | 0.889 | 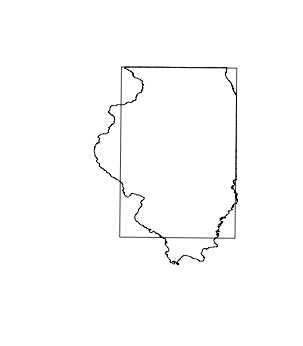 |
| 24 | Georgia | 0.89 | 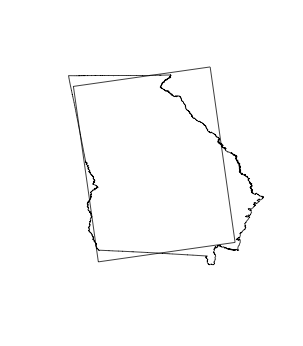 |
| 23 | District of Columbia | 0.902 | 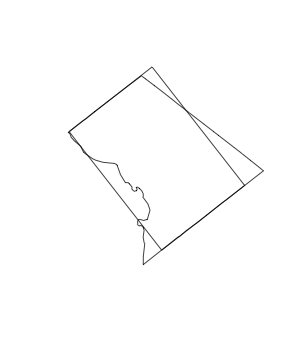 |
| 22 | Ohio | 0.906 | 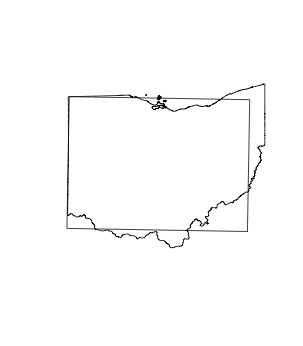 |
| 21 | Tennessee | 0.907 | 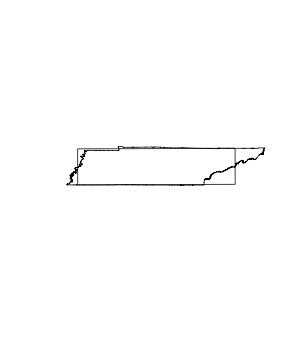 |
| 20 | Oklahoma | 0.914 | 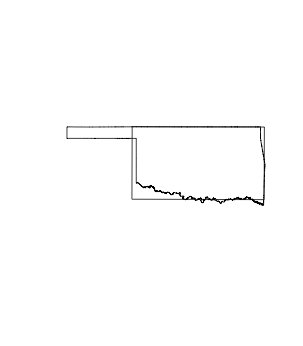 |
| 19 | Nebraska | 0.918 | 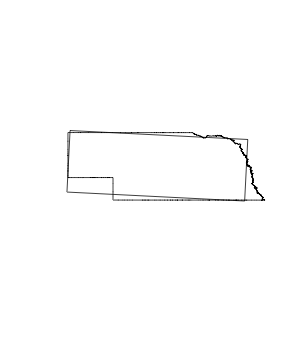 |
| 18 | Washington | 0.921 | 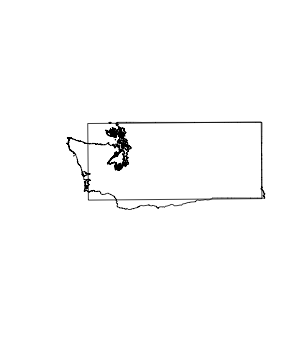 |
| 17 | Mississippi | 0.924 | 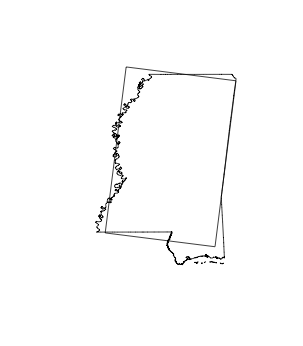 |
| 16 | Arkansas | 0.932 | 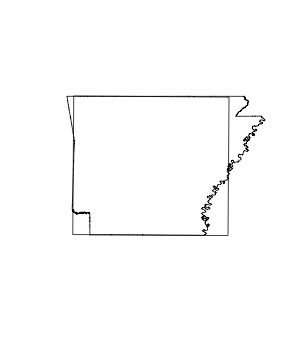 |
| 15 | Alabama | 0.935 | 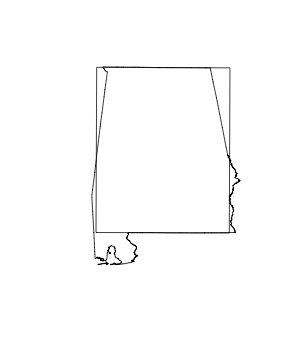 |
| 14 | Connecticut | 0.937 | 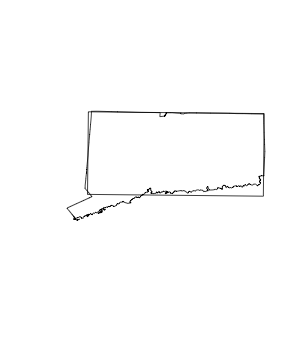 |
| 13 | Indiana | 0.94 | 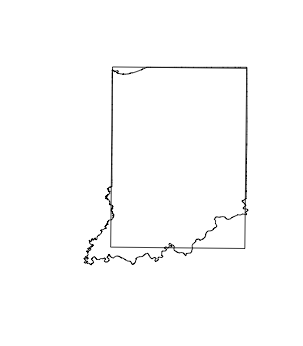 |
| 12 | Utah | 0.941 | 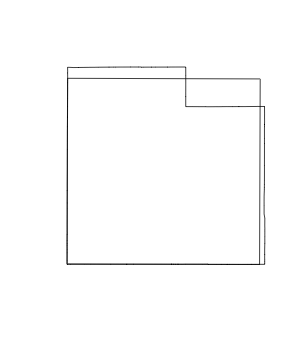 |
| 11 | Iowa | 0.942 | 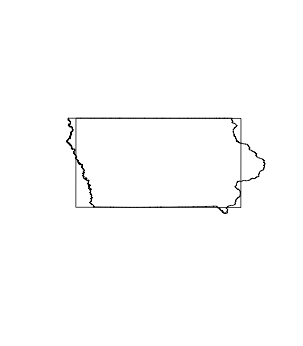 |
| 10 | Montana | 0.947 | 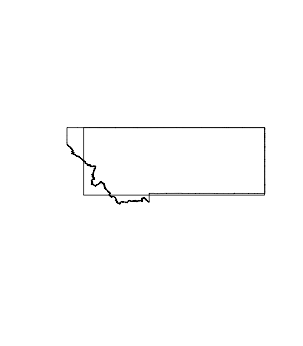 |
| 9 | Arizona | 0.953 | 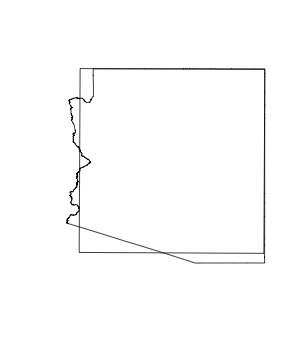 |
| 8 | Oregon | 0.956 | 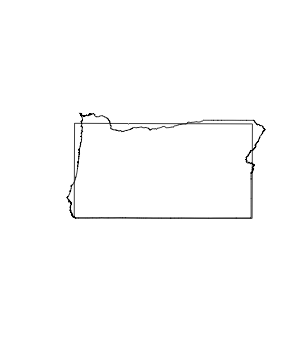 |
| 7 | New Mexico | 0.972 | 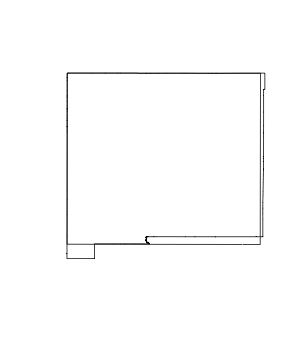 |
| 6 | Pennsylvania | 0.98 | 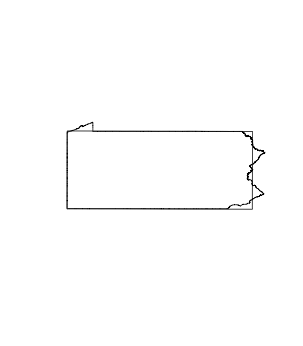 |
| 5 | South Dakota | 0.981 | 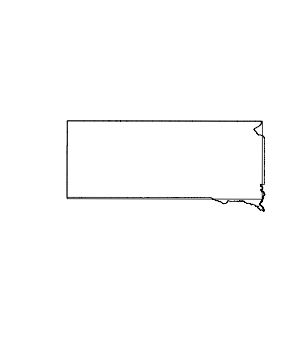 |
| 4 | North Dakota | 0.986 | 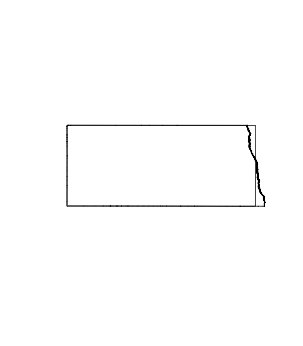 |
| 3 | Kansas | 0.988 |  |
| 2 | Colorado | 0.998 |  |
| 1 | Wyoming | 0.999 |  |
(How does it work? The code basically draws a rectangle, calculates how good a fit it is, then draws another one and compares. It keeps doing this until each iteration no longer makes improvements.)
Things get even squarer when we zoom in one level: to the counties. Again, particularly west of the Appalachians, American political subdivisions have often been often drawn based on geometry rather than geography or culture.
Indeed, while the typical state scored 0.861 on the rectangularness scale, the typical U.S. county scores a 0.907. The overall scale runs from 0.297 to 1.000, with almost 94 percent of counties being at least 80 percent rectangular.
There’s more than 3,000 counties and county-equivalents in the United States, so I won’t share all of them here. But here you can see each state’s average county rectangularness:
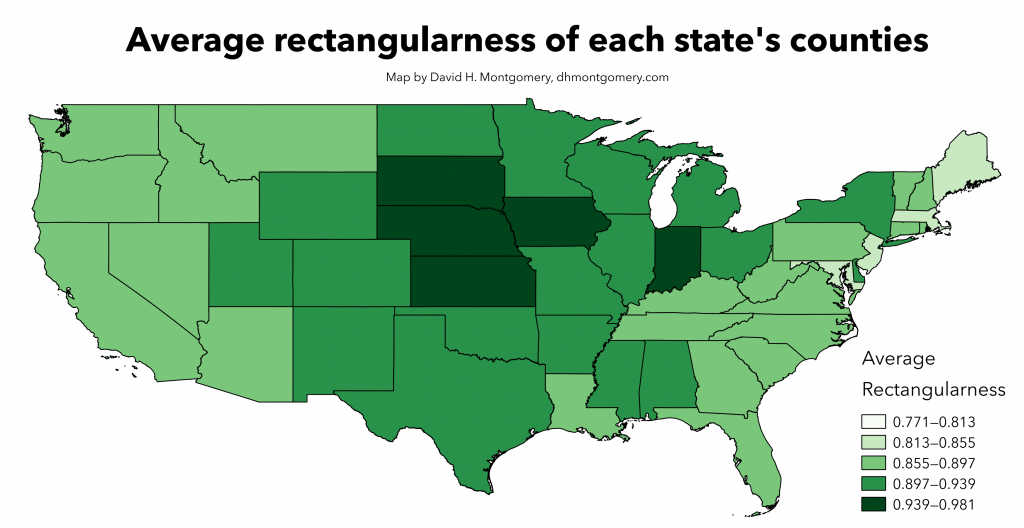
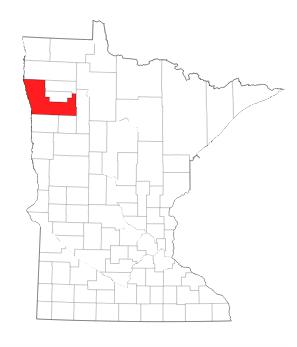
The state with the most rectangular counties is Kansas, with an average of 0.981. The state with the least rectangular counties is, unsurprisingly, Hawaii, with 0.771. My current home state of Minnesota is 11th-best with 0.927; my former home of South Dakota is fourth with 0.951. View a full list here.
 Finally, a special gift to Minnesotan readers: a breakdown of the rectangularness of each of Minnesota’s 87 counties.
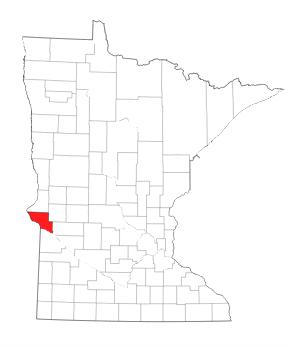
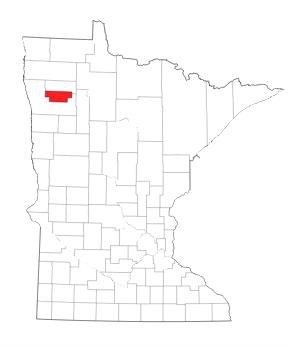
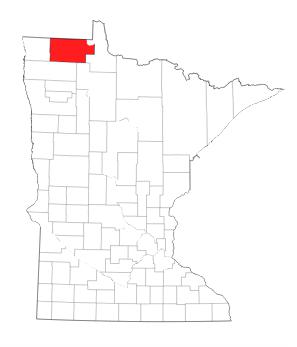
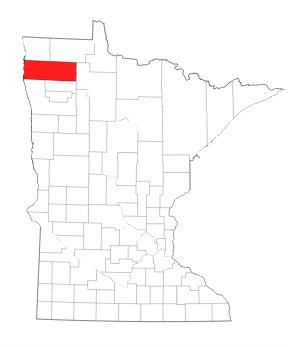
A number of them are almost 100 percent rectangular. Even Minnesota’s least-rectangular county (Polk, in northwestern Minnesota) is about 75 percent rectangular, far better than California or Michigan, or Laos or Denmark.
(I know enough, however, not to venture any opinions on what this rectangularness data says about which counties are the worst places to live.)
Take a look!
| Rank | County | Index | Rectangle-ness | Location |
|---|---|---|---|---|
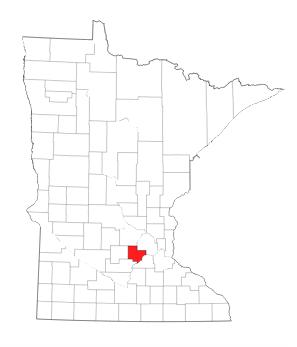
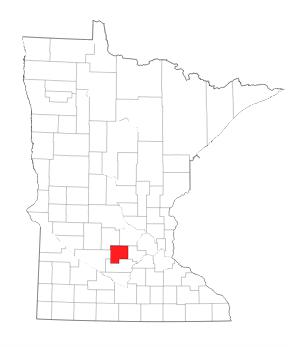
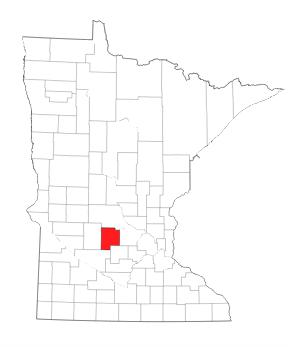
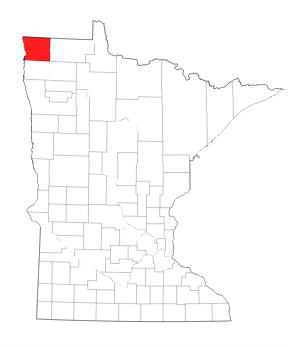
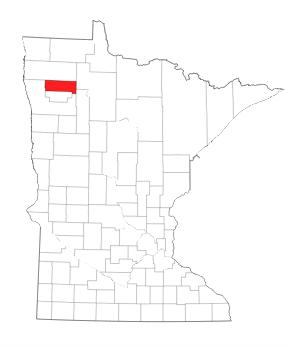
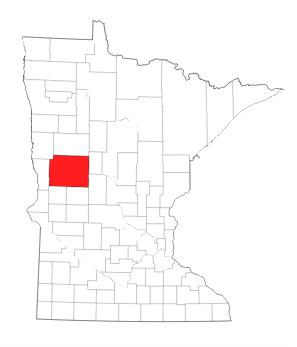
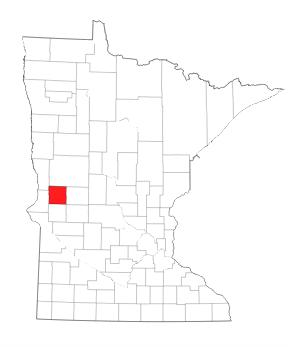
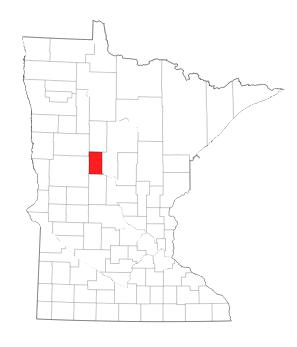
| 87 | Polk | 0.765 | 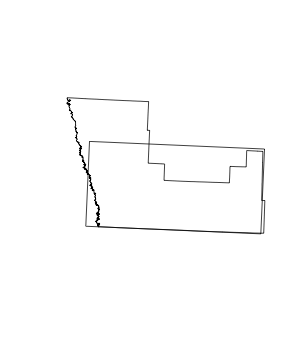 |
 |
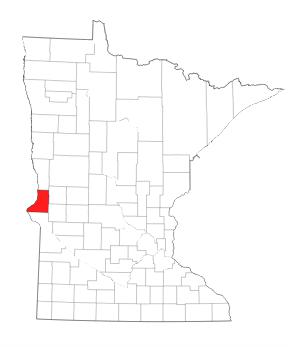
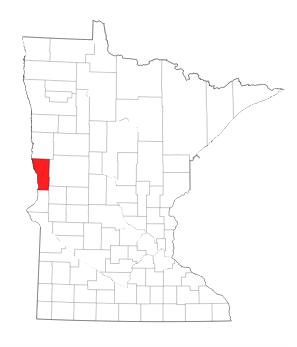
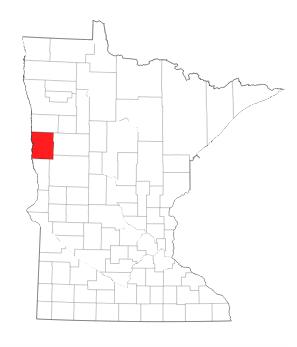
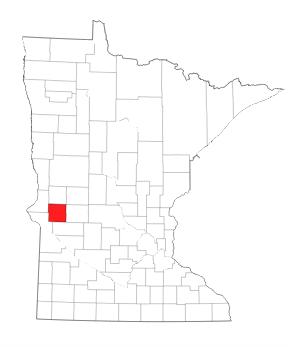
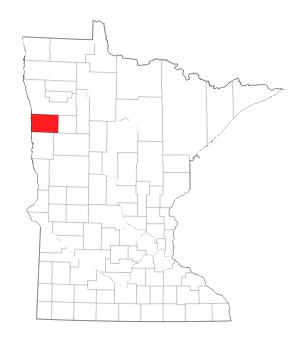
| 86 | Big Stone | 0.776 | 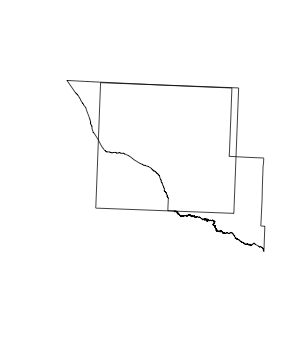 |
 |
| 85 | Lake of the Woods | 0.814 | 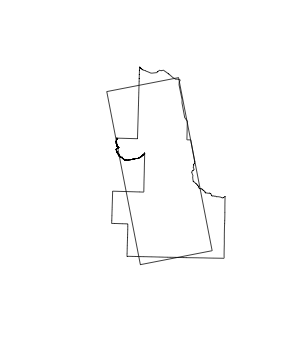 |
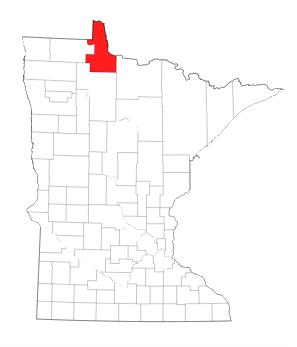 |
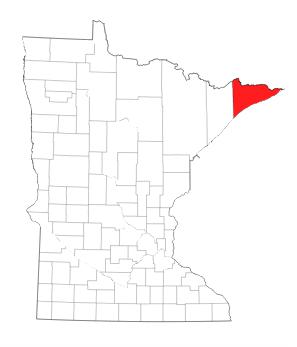
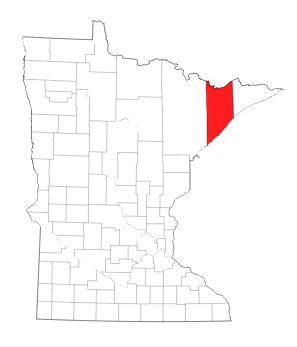
| 83 | Cook | 0.817 | 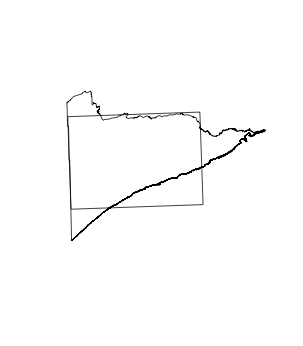 |
 |
| 83 | Traverse | 0.817 | 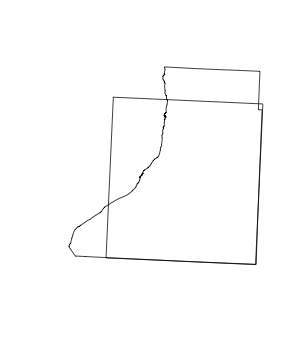 |
 |
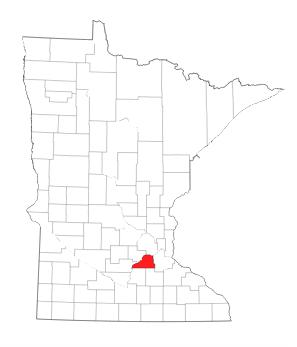
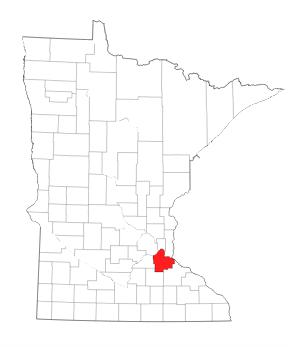
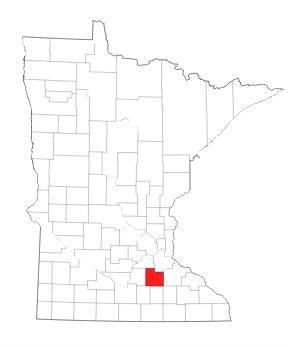
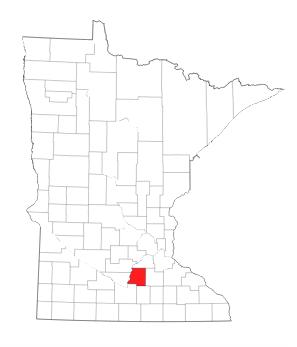
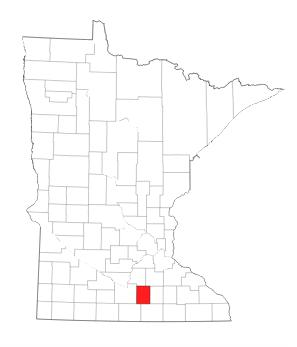
| 82 | Scott | 0.818 | 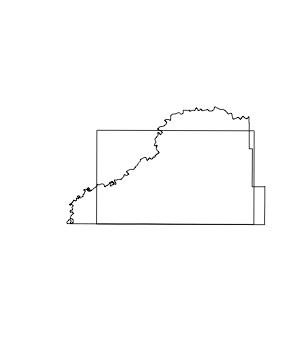 |
 |
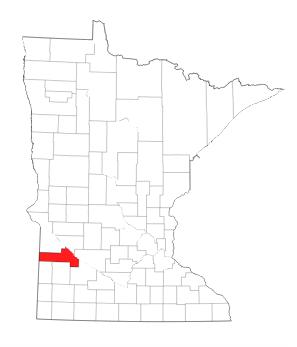
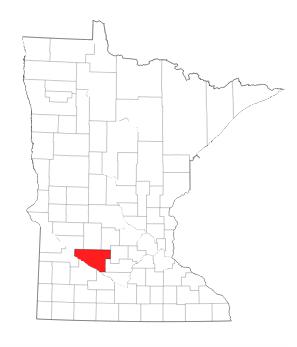
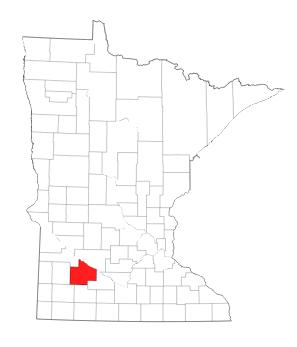
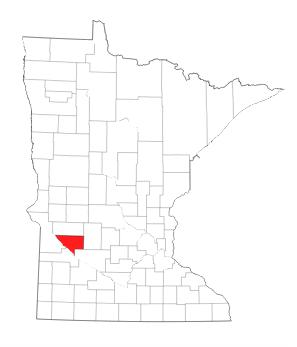
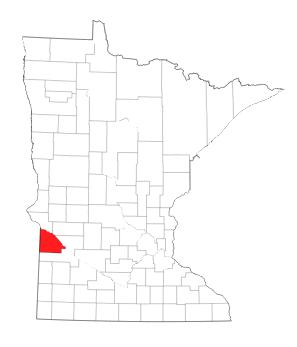
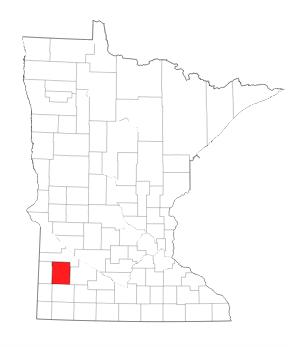
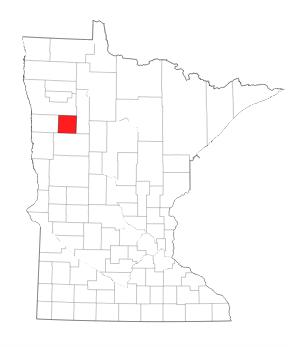
| 81 | Yellow Medicine | 0.819 | 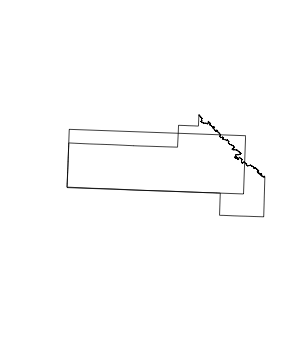 |
 |
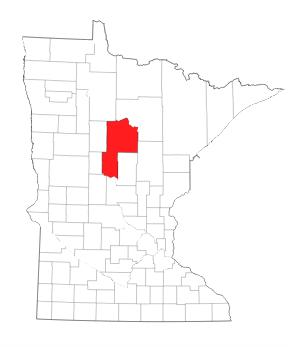
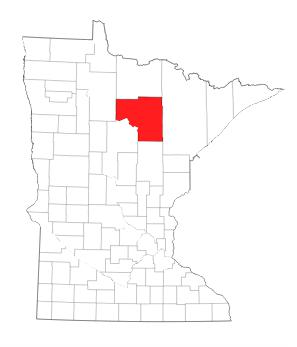
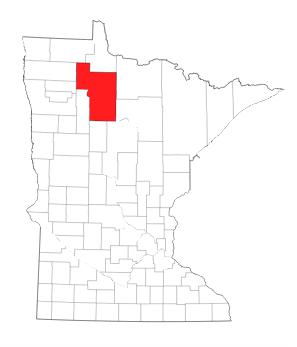
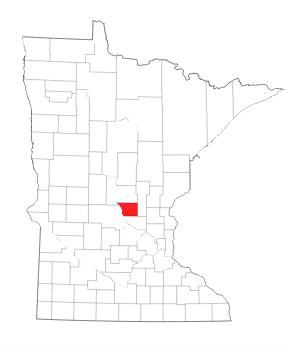
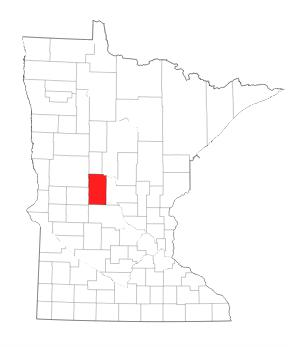
| 80 | Cass | 0.822 | 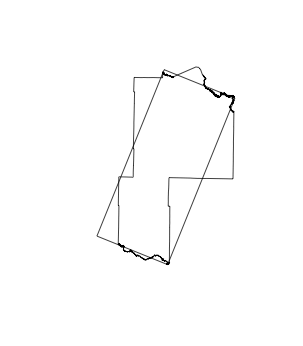 |
 |
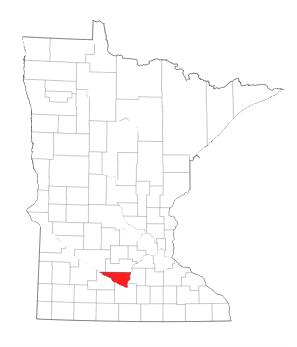
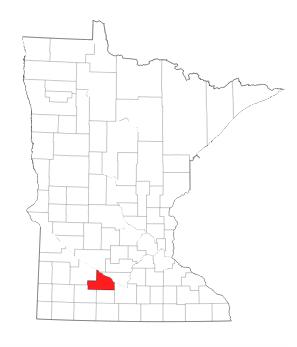
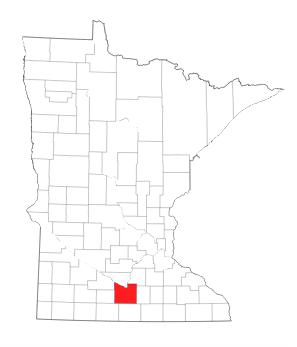
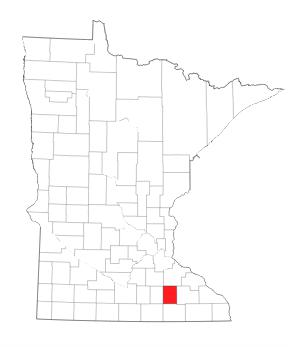
| 79 | Nicollet | 0.832 | 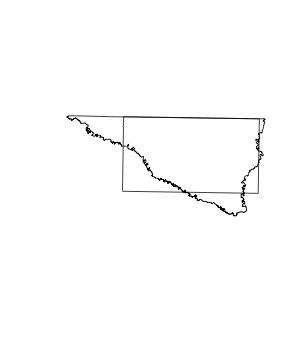 |
 |
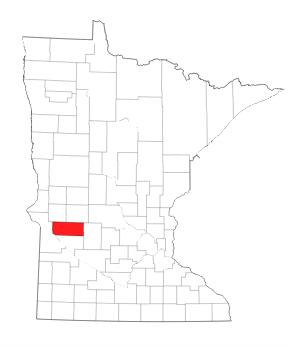
| 78 | Renville | 0.84 | 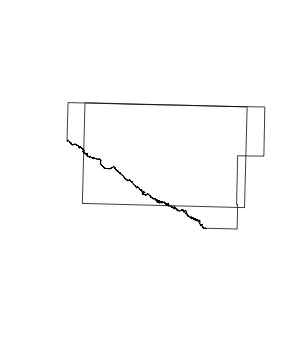 |
 |
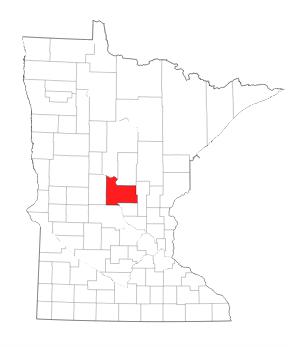
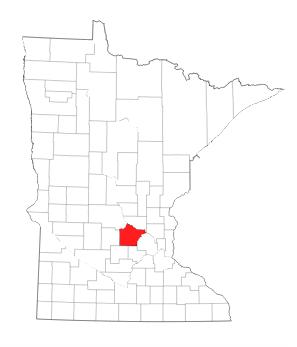
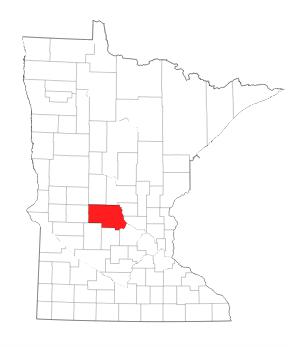
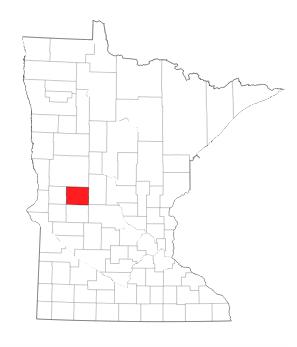
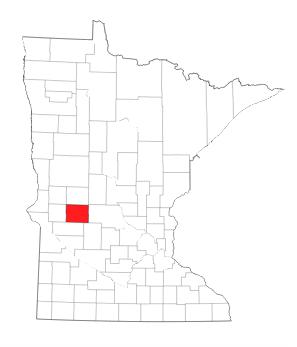
| 77 | Morrison | 0.855 | 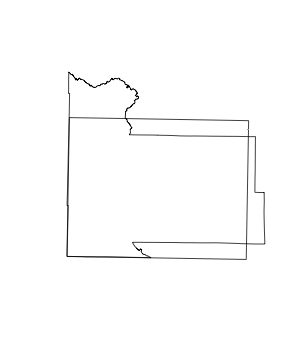 |
 |
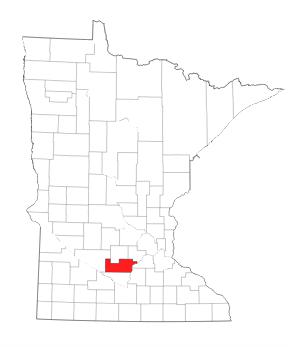
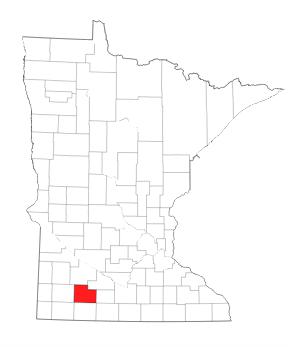
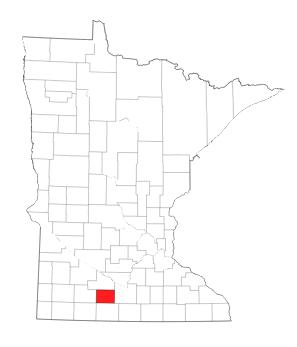
| 75 | Brown | 0.857 | 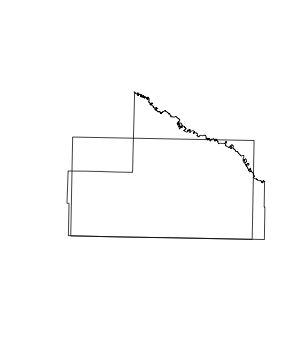 |
 |
| 75 | Winona | 0.857 | 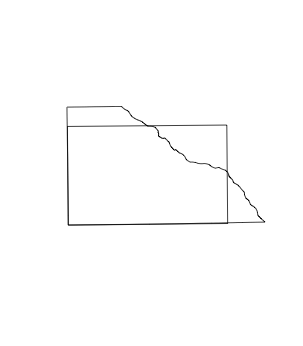 |
 |
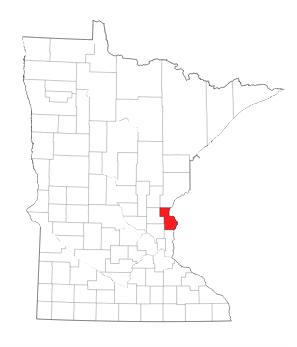
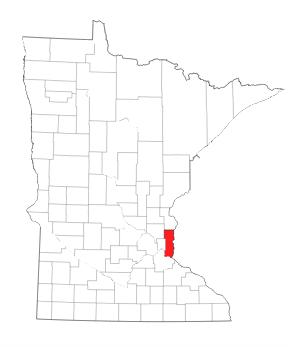
| 74 | Chisago | 0.859 | 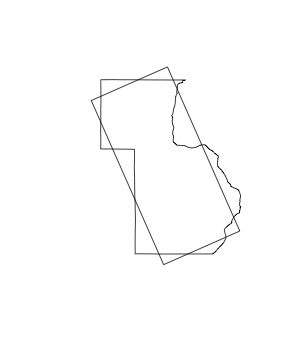 |
 |
| 73 | Goodhue | 0.86 | 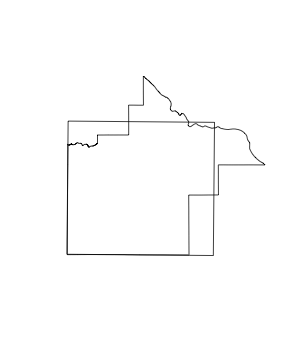 |
 |
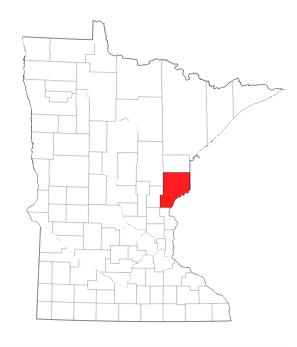
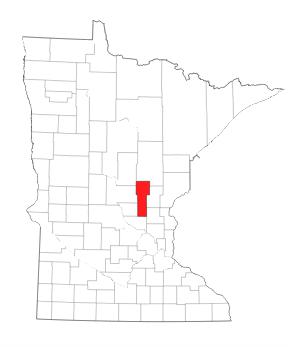
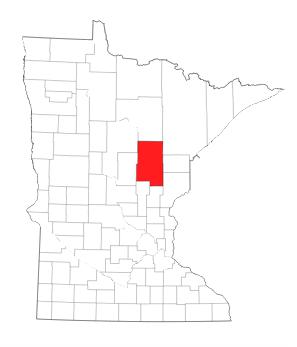
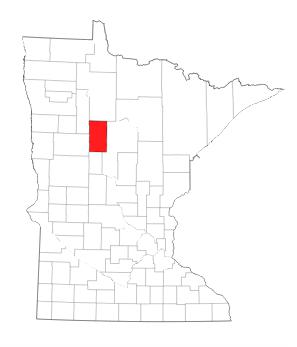
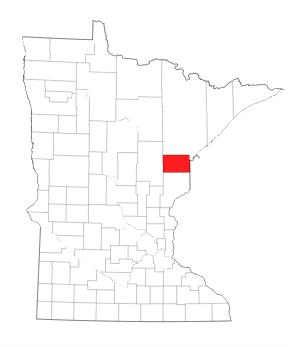
| 72 | Itasca | 0.862 | 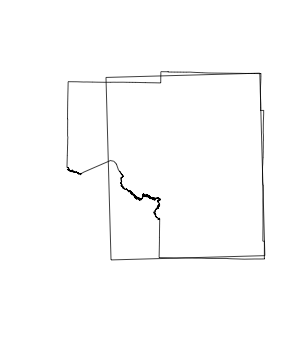 |
 |
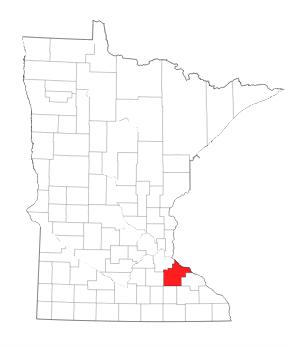
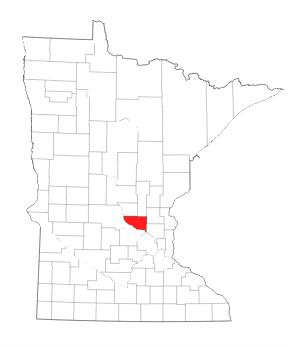
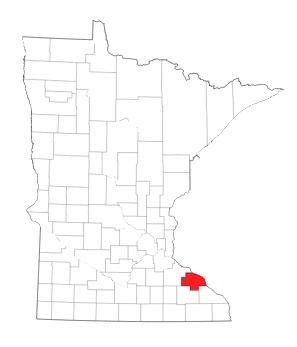
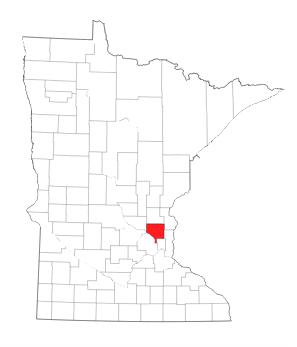
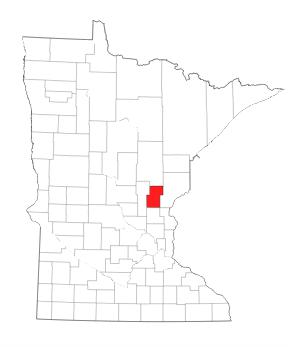
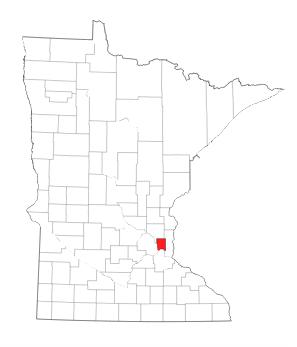
| 70 | Pine | 0.864 | 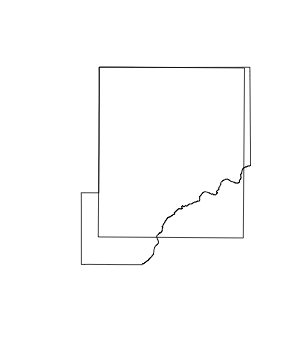 |
 |
| 70 | Redwood | 0.864 | 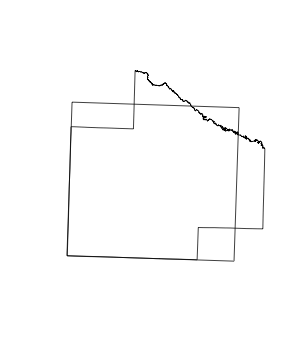 |
 |
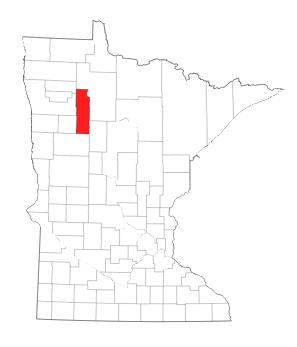
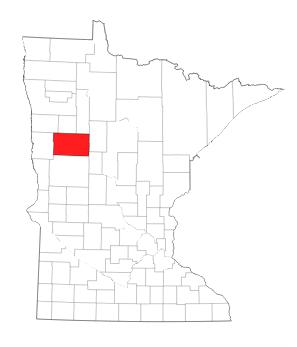
| 68 | Beltrami | 0.866 | 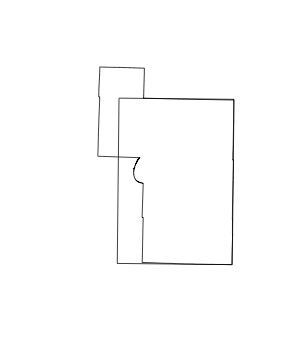 |
 |
| 68 | Dakota | 0.866 | 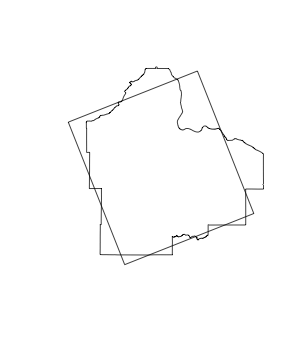 |
 |
| 67 | Chippewa | 0.885 | 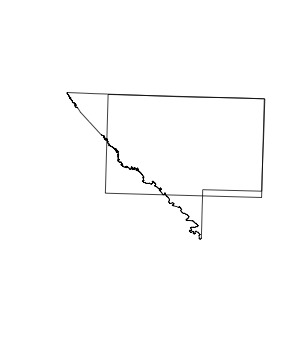 |
 |
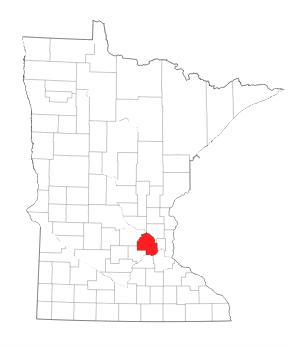
| 66 | Sherburne | 0.887 | 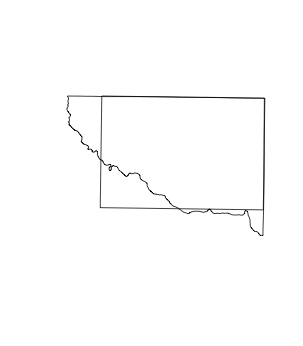 |
 |
| 64 | Hennepin | 0.888 | 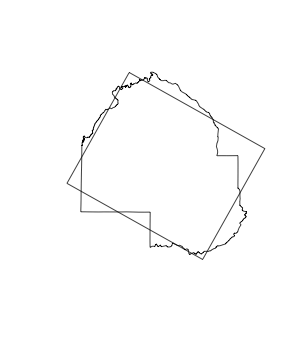 |
 |
| 64 | Carver | 0.888 | 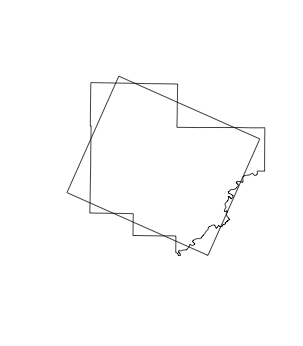 |
 |
| 62 | Wright | 0.893 | 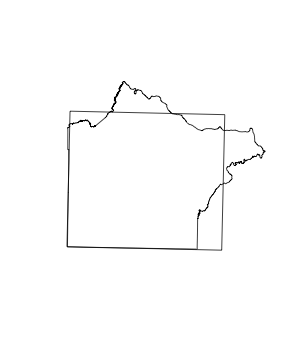 |
 |
| 62 | Wabasha | 0.893 | 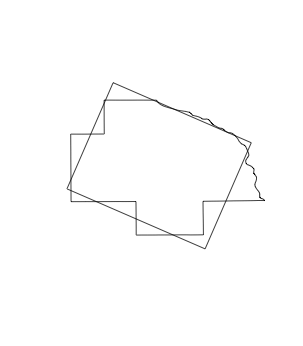 |
 |
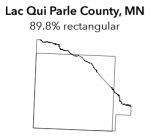
| 60 | Lac Qui Parle | 0.898 | 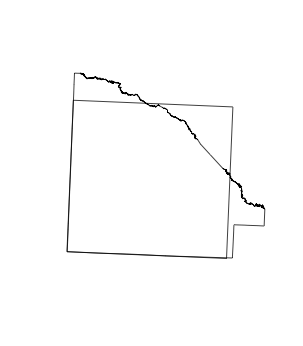 |
 |
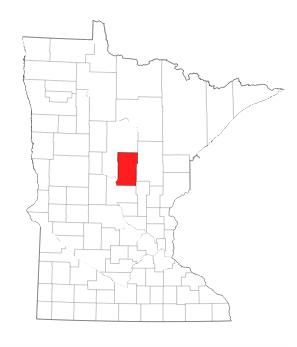
| 60 | Mille Lacs | 0.898 | 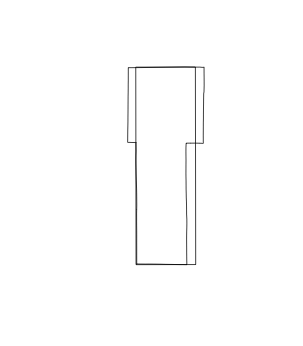 |
 |
| 59 | Sibley | 0.901 | 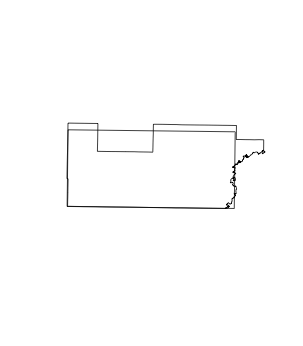 |
 |
| 57 | Lake | 0.904 | 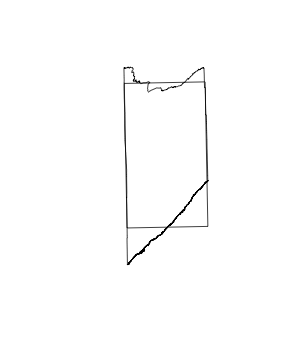 |
 |
| 57 | Red Lake | 0.904 | 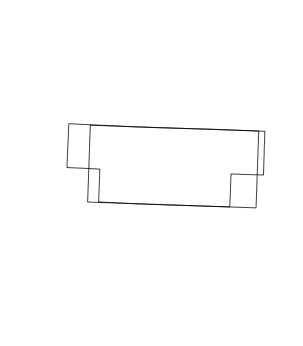 |
 |
| 56 | Anoka | 0.907 | 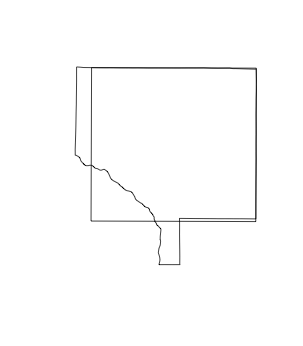 |
 |
| 54 | Isanti | 0.909 | 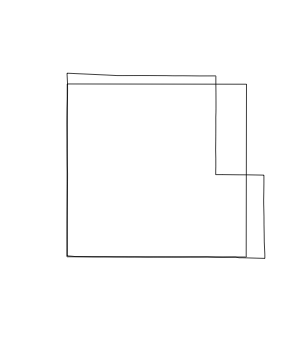 |
 |
| 54 | McLeod | 0.909 | 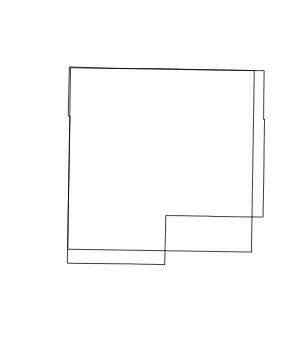 |
 |
| 53 | Wilkin | 0.91 | 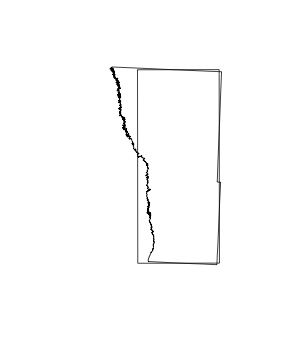 |
 |
| 52 | Meeker | 0.911 | 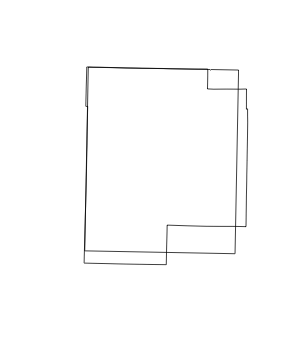 |
 |
| 51 | Olmsted | 0.915 | 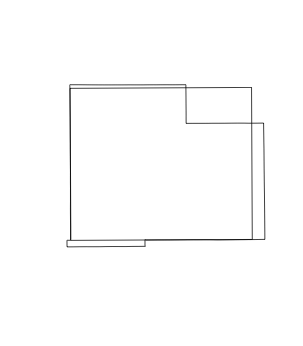 |
 |
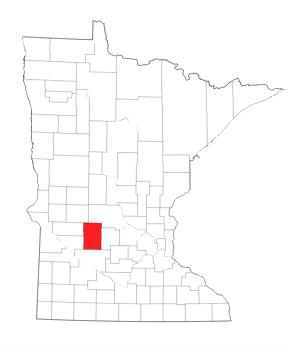
| 50 | Stearns | 0.916 | 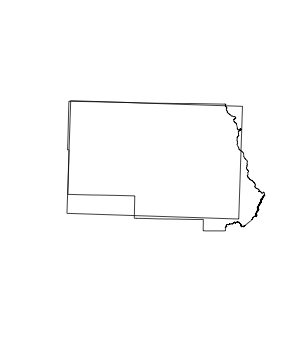 |
 |
| 49 | Cottonwood | 0.922 | 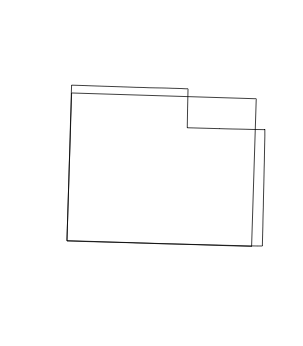 |
 |
| 48 | Rice | 0.925 | 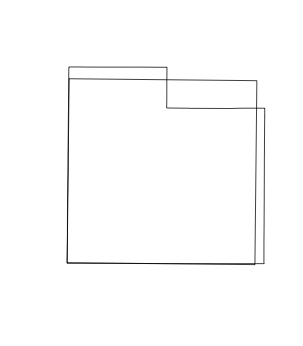 |
 |
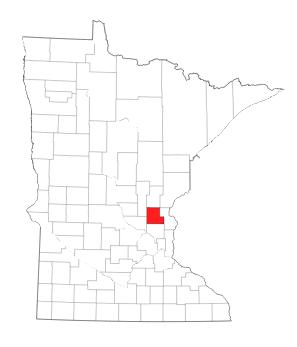
| 47 | Kanabec | 0.926 | 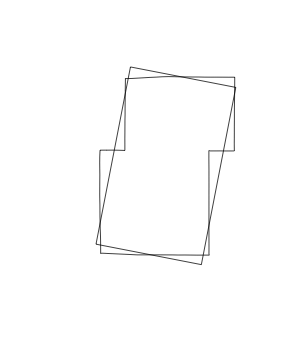 |
 |
| 46 | Le Sueur | 0.936 | 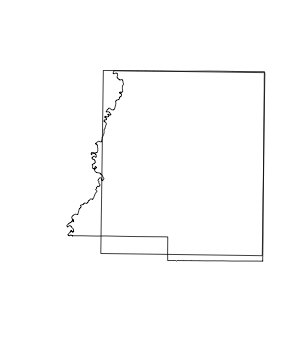 |
 |
| 45 | Washington | 0.937 | 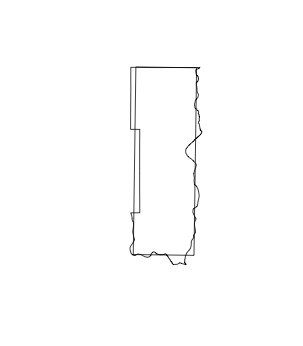 |
 |
| 44 | Roseau | 0.946 | 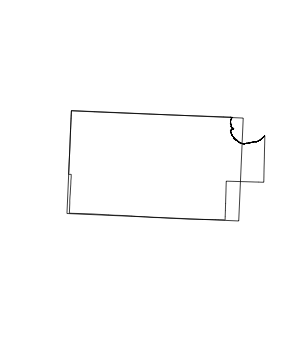 |
 |
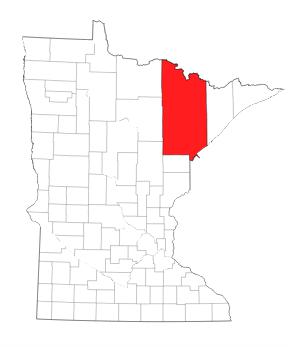
| 43 | Saint Louis | 0.947 | 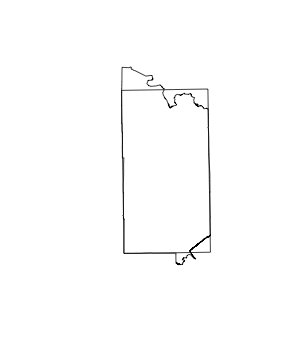 |
 |
| 42 | Ramsey | 0.951 | 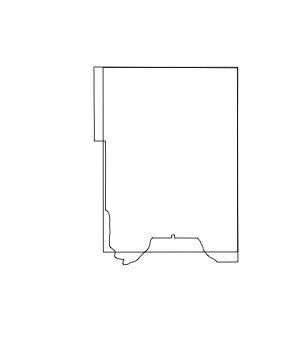 |
 |
| 40 | Koochiching | 0.952 | 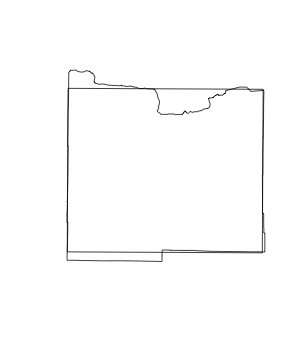 |
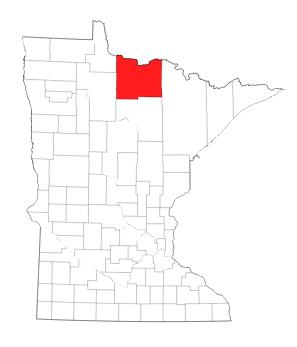 |
| 40 | Benton | 0.952 | 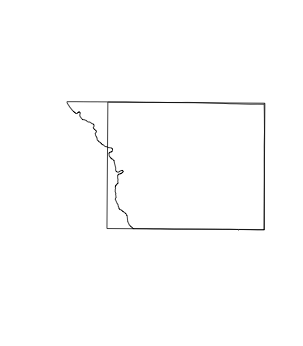 |
 |
| 39 | Aitkin | 0.96 | 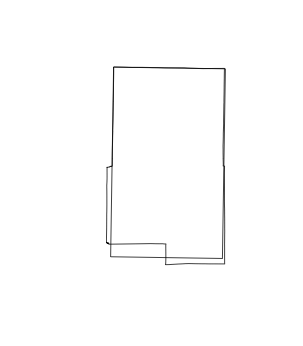 |
 |
| 38 | Blue Earth | 0.961 | 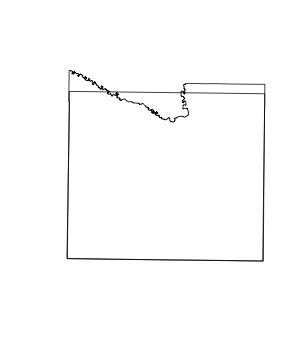 |
 |
| 37 | Clearwater | 0.97 | 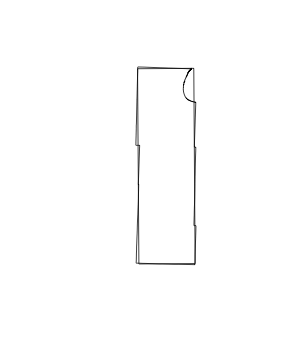 |
 |
| 36 | Kittson | 0.972 | 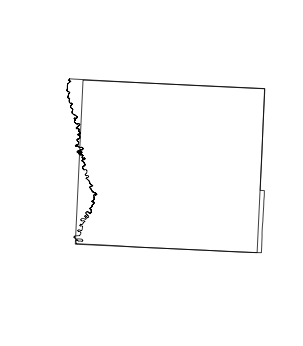 |
 |
| 35 | Crow Wing | 0.975 | 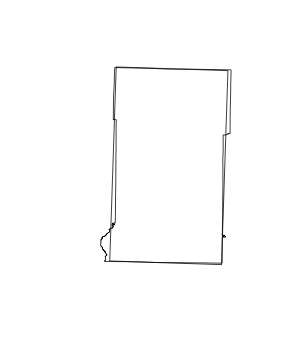 |
 |
| 33 | Pennington | 0.98 | 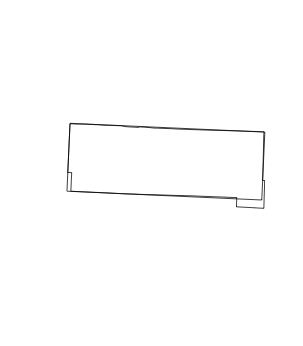 |
 |
| 33 | Clay | 0.98 | 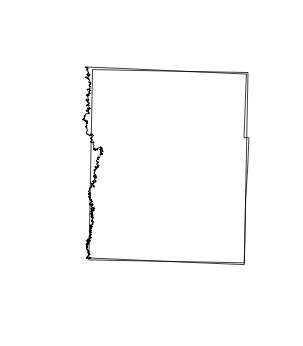 |
 |
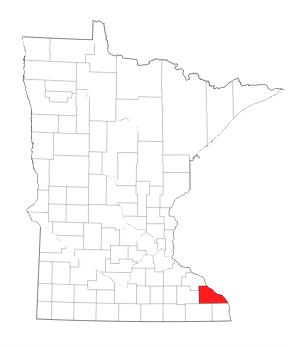
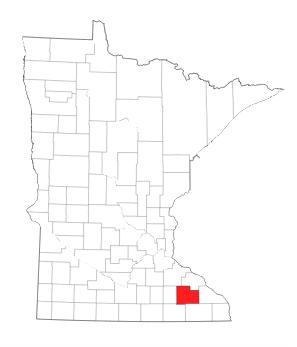
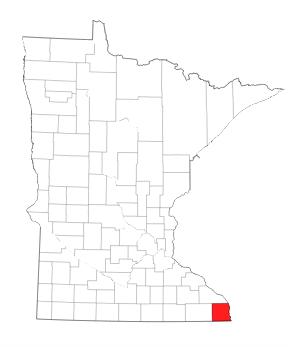
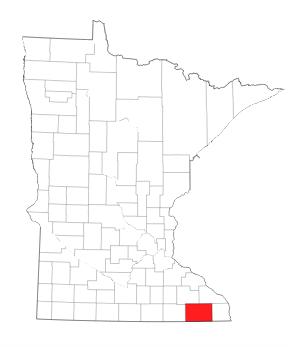
| 32 | Houston | 0.983 | 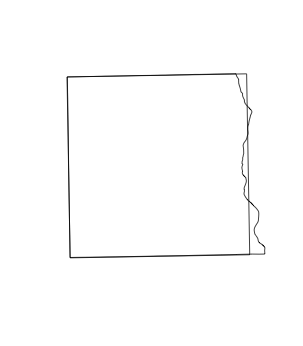 |
 |
| 31 | Otter Tail | 0.986 |  |
 |
| 29 | Grant | 0.988 |  |
 |
| 29 | Stevens | 0.988 | 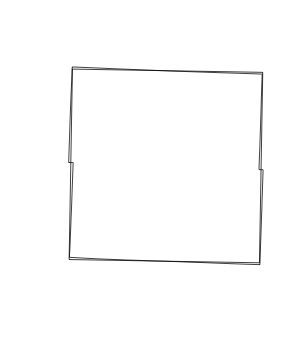 |
 |
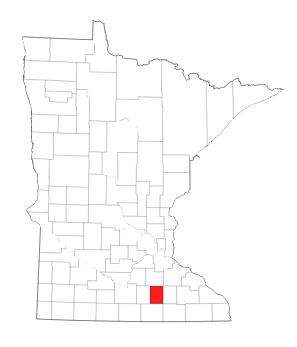
| 28 | Mower | 0.989 | 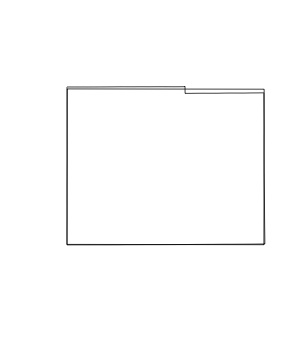 |
 |
| 27 | Wadena | 0.99 | 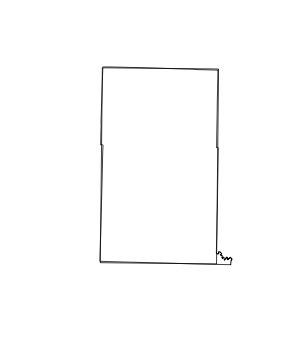 |
 |
| 26 | Swift | 0.991 | 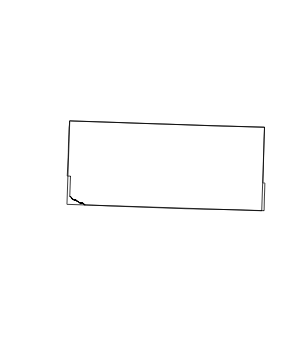 |
 |
| 23 | Douglas | 0.992 | 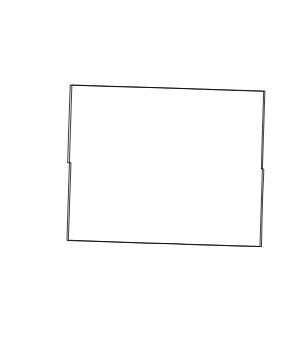 |
 |
| 23 | Pope | 0.992 | 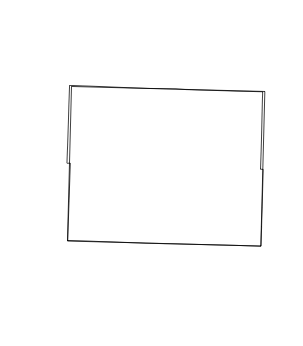 |
 |
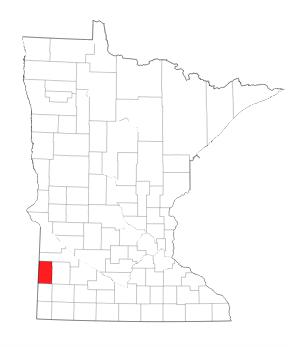
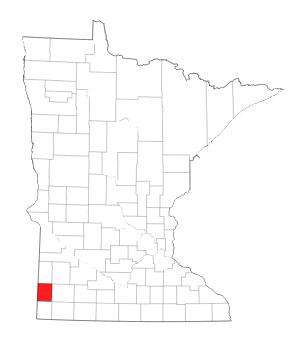
| 23 | Lincoln | 0.992 | 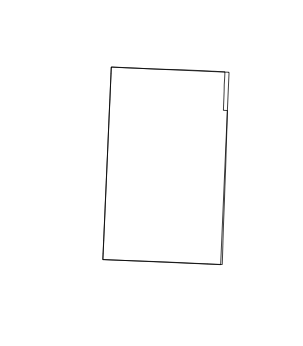 |
 |
| 17 | Marshall | 0.993 | 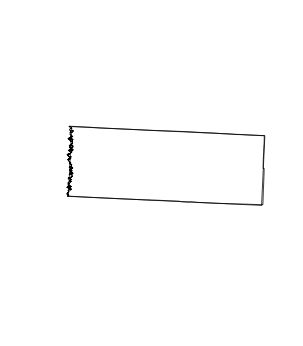 |
 |
| 17 | Norman | 0.993 | 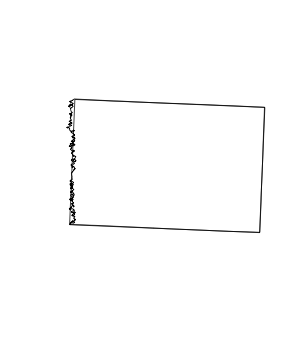 |
 |
| 17 | Hubbard | 0.993 | 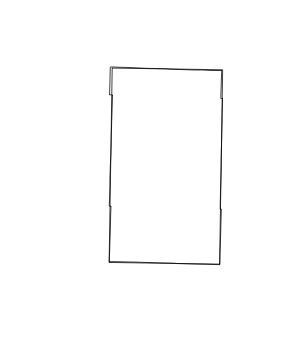 |
 |
| 17 | Becker | 0.993 |  |
 |
| 17 | Todd | 0.993 |  |
 |
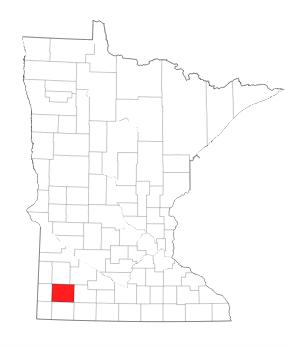
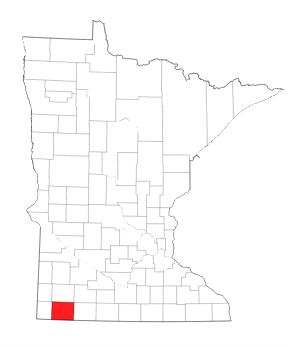
| 17 | Lyon | 0.993 | 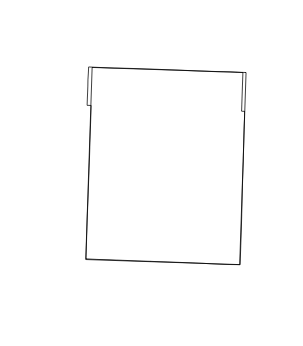 |
 |
| 15 | Carlton | 0.994 | 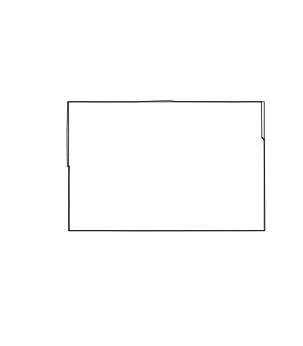 |
 |
| 15 | Kandiyohi | 0.994 | 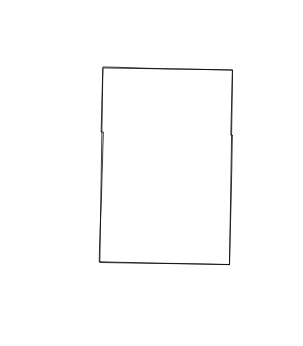 |
 |
| 8 | Pipestone | 0.997 | 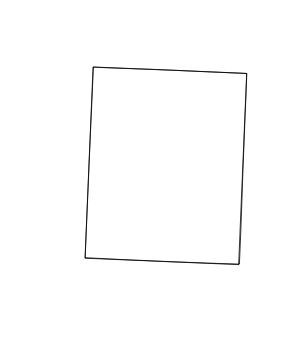 |
 |
| 8 | Murray | 0.997 | 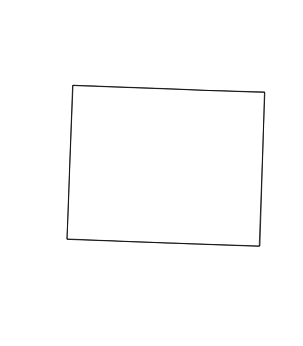 |
 |
| 8 | Steele | 0.997 | 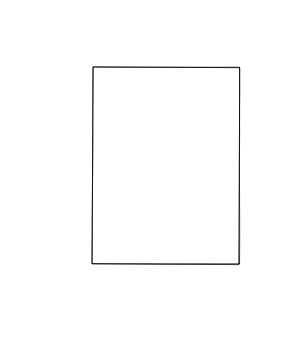 |
 |
| 8 | Nobles | 0.997 | 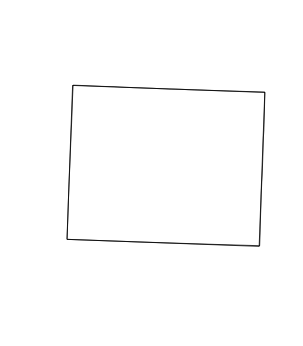 |
 |
| 8 | Jackson | 0.997 | 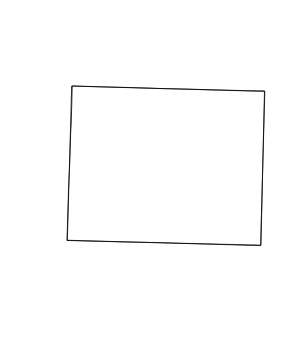 |
 |
| 8 | Fillmore | 0.997 |  |
 |
| 8 | Waseca | 0.997 |  |
 |
| 4 | Mahnomen | 0.998 |  |
 |
| 4 | Dodge | 0.998 |  |
 |
| 4 | Watonwan | 0.998 | 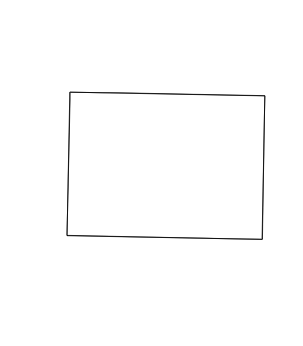 |
 |
| 4 | Rock | 0.998 | 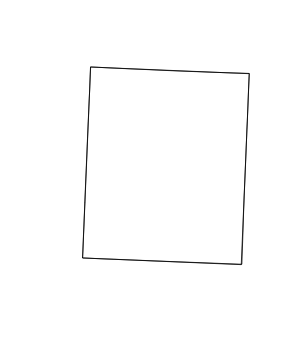 |
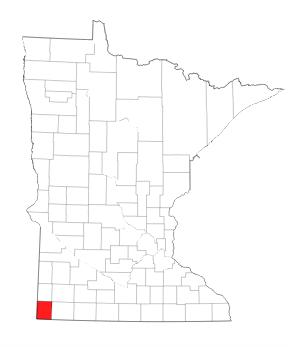 |
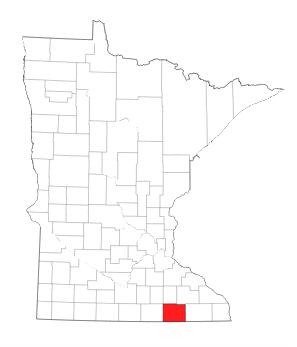
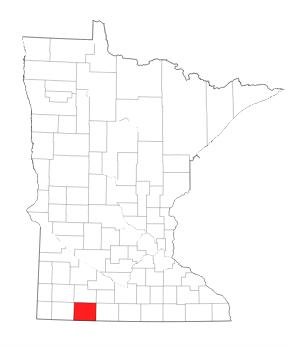
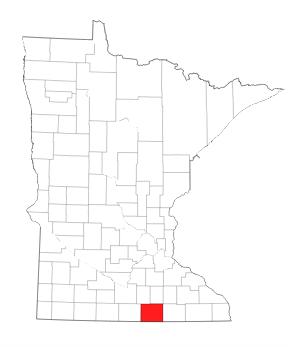
| 1 | Martin | 0.999 | 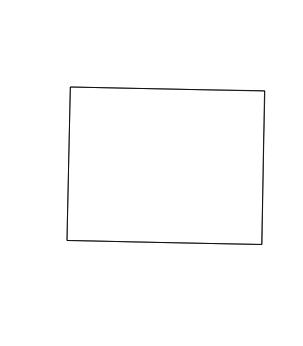 |
 |
| 1 | Faribault | 0.999 | 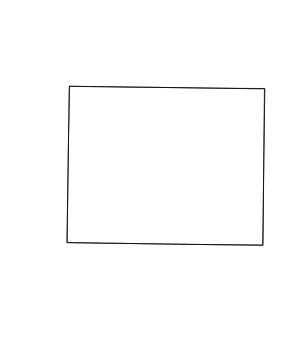 |
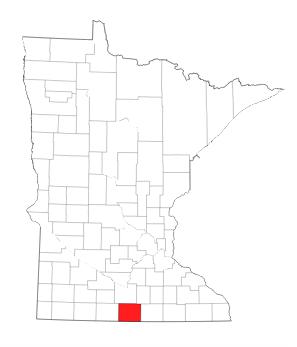 |
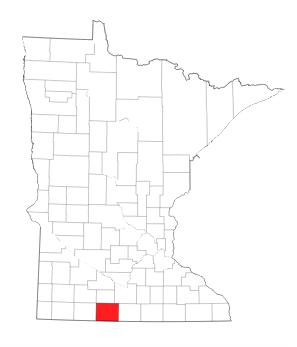
| 1 | Freeborn | 0.999 |  |
 |
-
An infamous French Revolution proposal to divide France into square départements would have given America a run for its money. ↩