A history of nuclear testing in nine charts
As North Korea draws headlines for repeated nuclear tests, President Donald Trump is reportedly mulling a response in kind: new American test nuclear detonations for the first time since 1992.
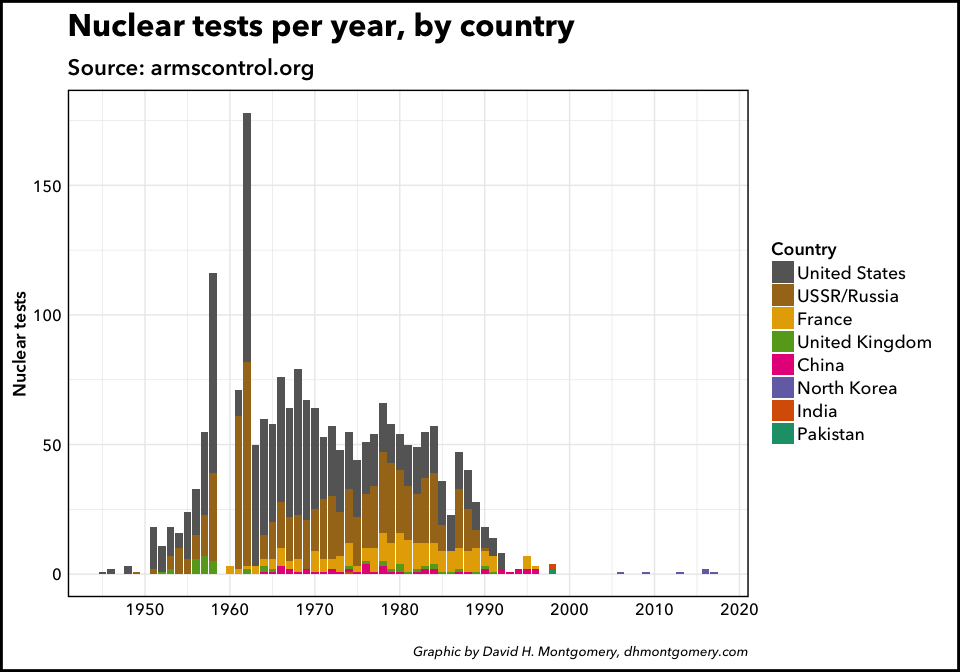
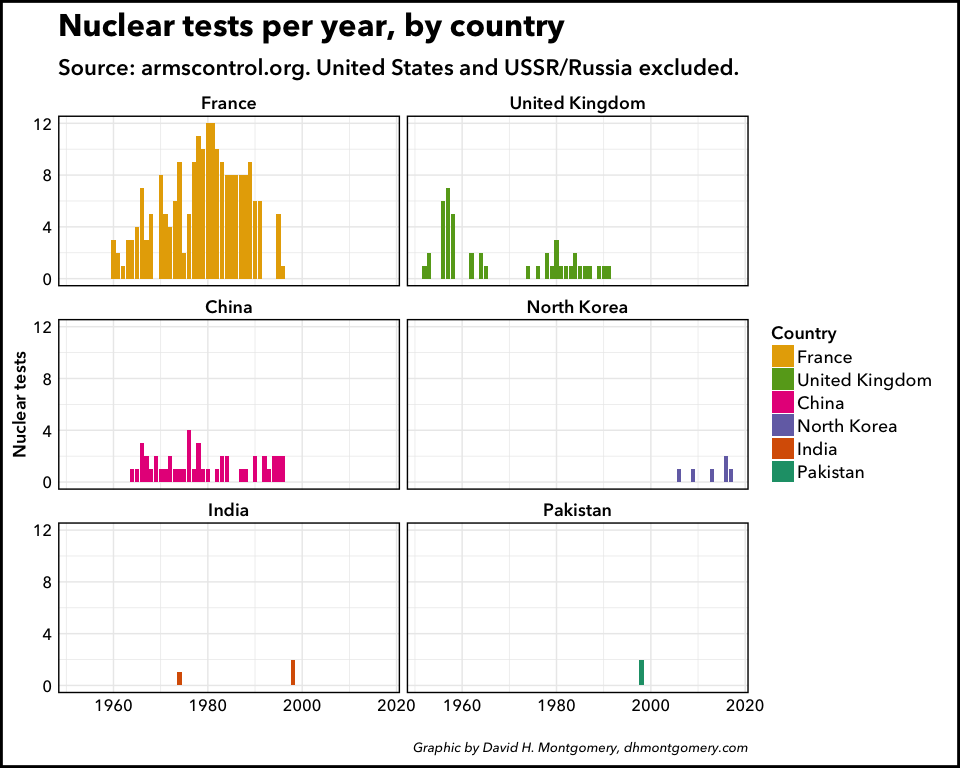
If this does happen — and if other nuclear powers follow suit — it could represent a dramatic shift in nuclear testing trends. While the world once saw dozens of nuclear explosions per year, since the end of the Cold War there have only been a handful of nuclear tests. In addition, while the Cold War period saw primarily nuclear tests by the five permanent members of the U.N. Security Council (the United States, the USSR/Russia, the United Kingdom, France and China), the sporadic tests since then have been by new entrants to the nuclear club: India, Pakistan and North Korea.
I pulled data on nuclear tests1 from the Arms Control Association, which tracks publicly announced tests each year since 1945 by country. (This means that its data does not include test detonations widely believed to have been conducted by Israel, since Israel has never publicly acknowledged a nuclear program.)
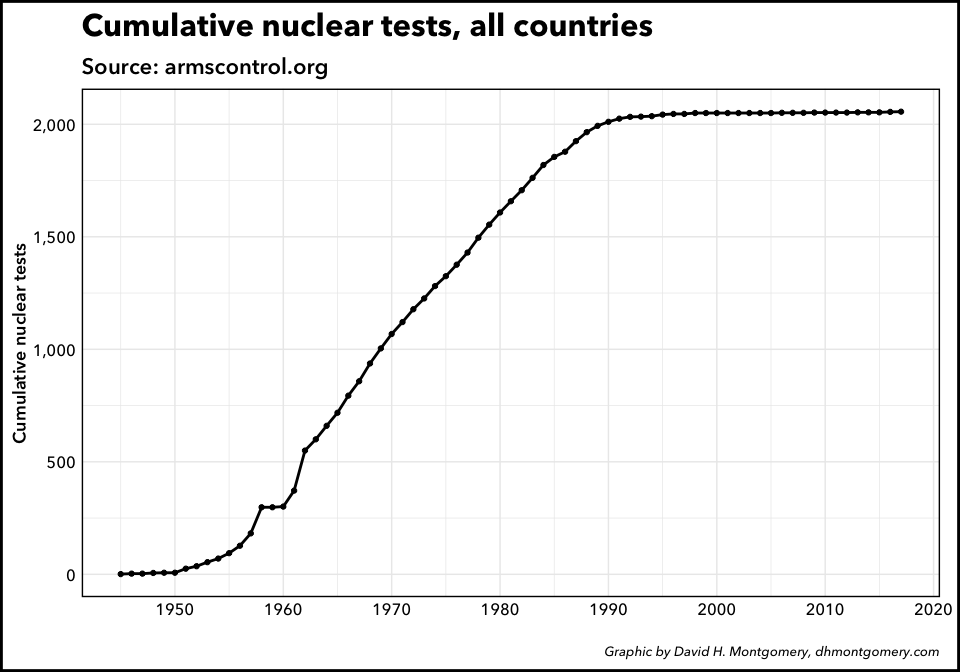
You can see the overall trend clearly on this chart of all publicly acknowledged nuclear tests ever:

The recent decline is, if anything, starker when grouped by decade instead of year:

Tests by country
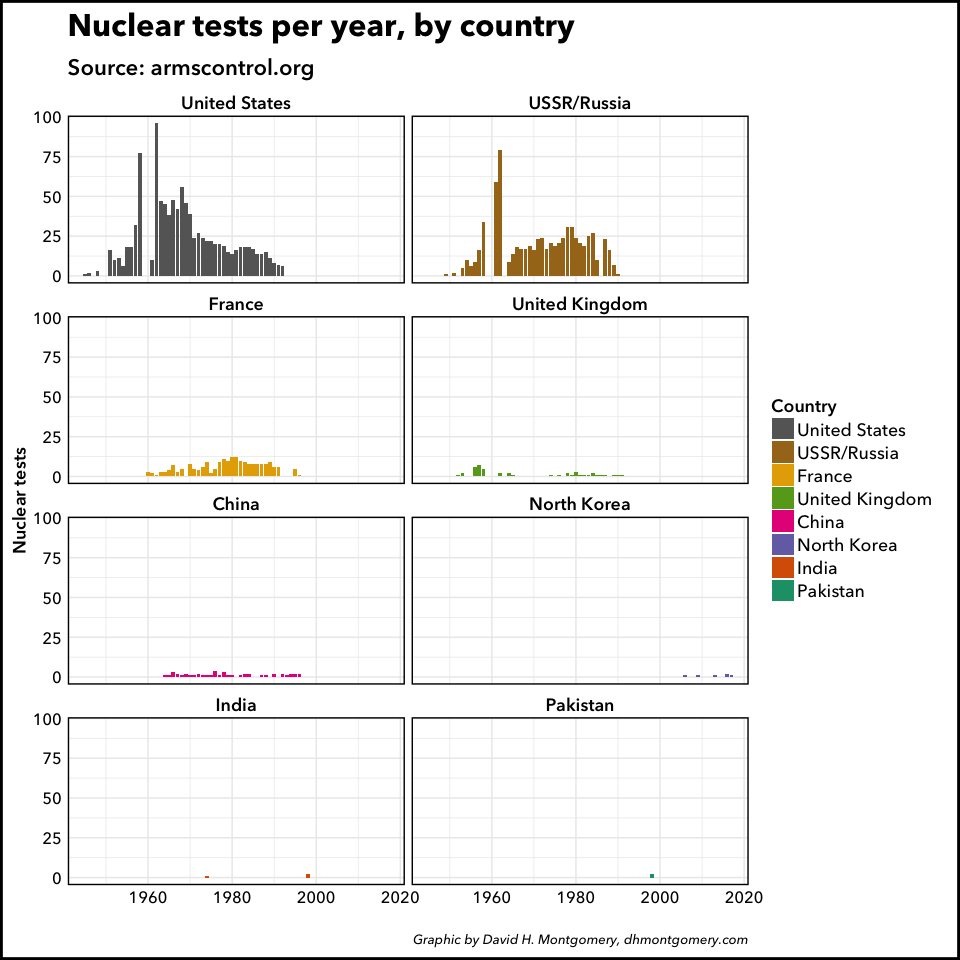
Eight countries have publicly acknowledged nuclear programs: the United States, Russia, China, Great Britain, France, India, Pakistan and North Korea. Of those, 84.8 percent of the 2,056 nuclear tests in the database have been conducted by just the United States and the USSR/Russia. Around 14.6 percent have been conducted by France, China and Great Britain. India, Pakistan and North Korea have combined for 11 tests, or 0.6 percent of the total.

Here we can see the earlier graph of tests per year, with different countries identified by color:
For a clearer view, we can plot each country’s nuclear tests separately:
The scale there is a bit dominated by the United States and the USSR/Russia, so here’s the graph again with those countries omitted:
Cumulative tests
From the mid-1950s through 1990, the world saw a fairly linear increase in the number of total nuclear tests ever conducted, broken only by a brief pause in the late 1950s and a brief surge in the early 1960s. That’s an average of 53.9 nuclear tests per year over that time, though the actual annual rate varied between zero and 178.
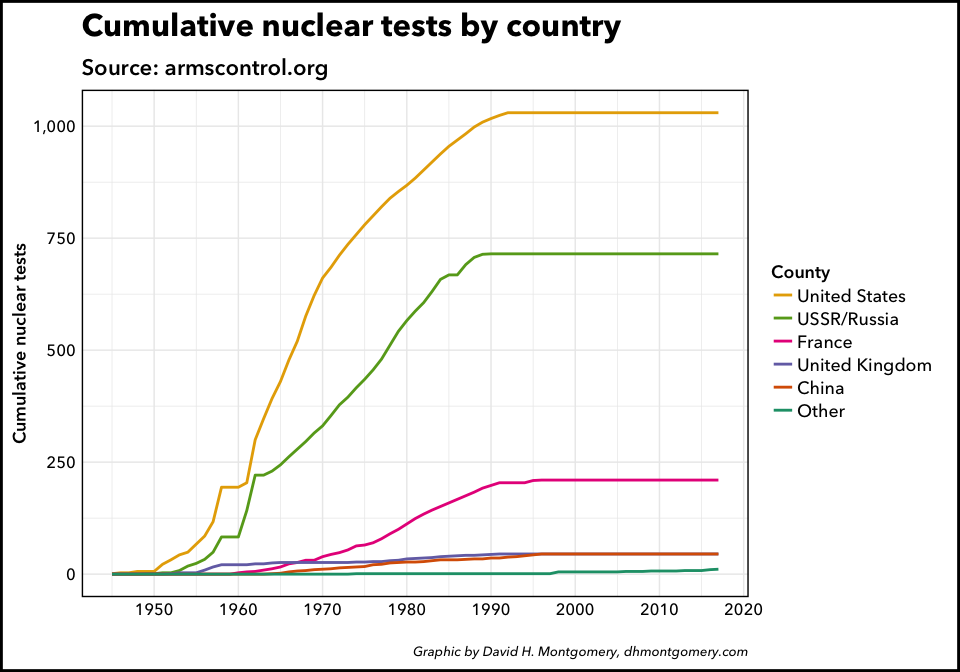
Breaking the data down by country, the dominance of France, the USSR and, especially, the United States is clear.
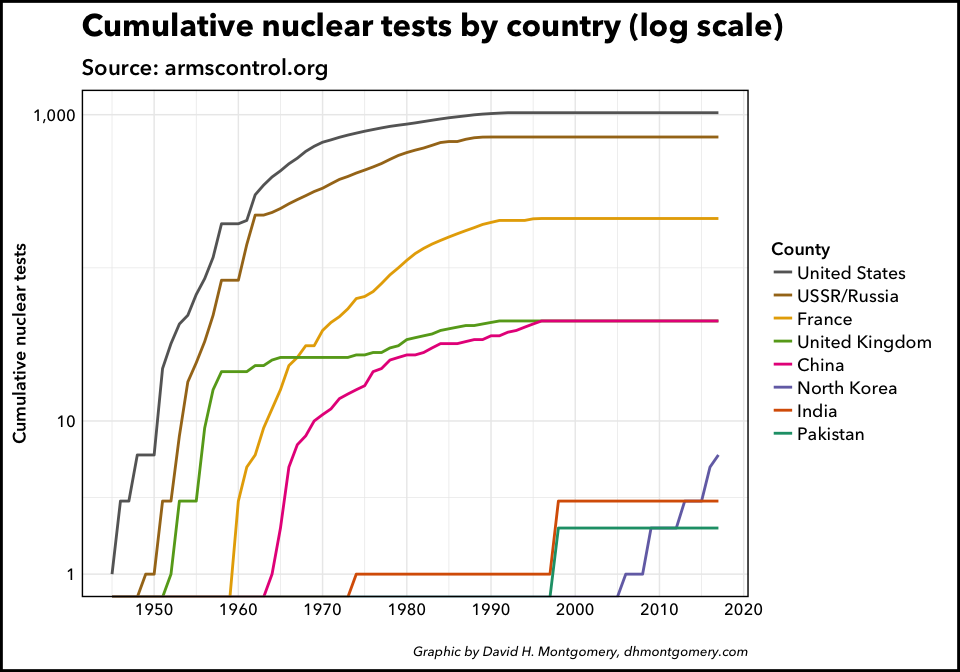
The sheer number of tests conducted by the U.S. and Soviet Union can obscure some of the less-prolific nuclear testers, so here’s that same graph again but on a log scale:
-
I was inspired by a post on Reddit’s “r/dataisbeautiful” subreddit. ↩