Animation: Growth of the Twin Cities metro area, 1870-present
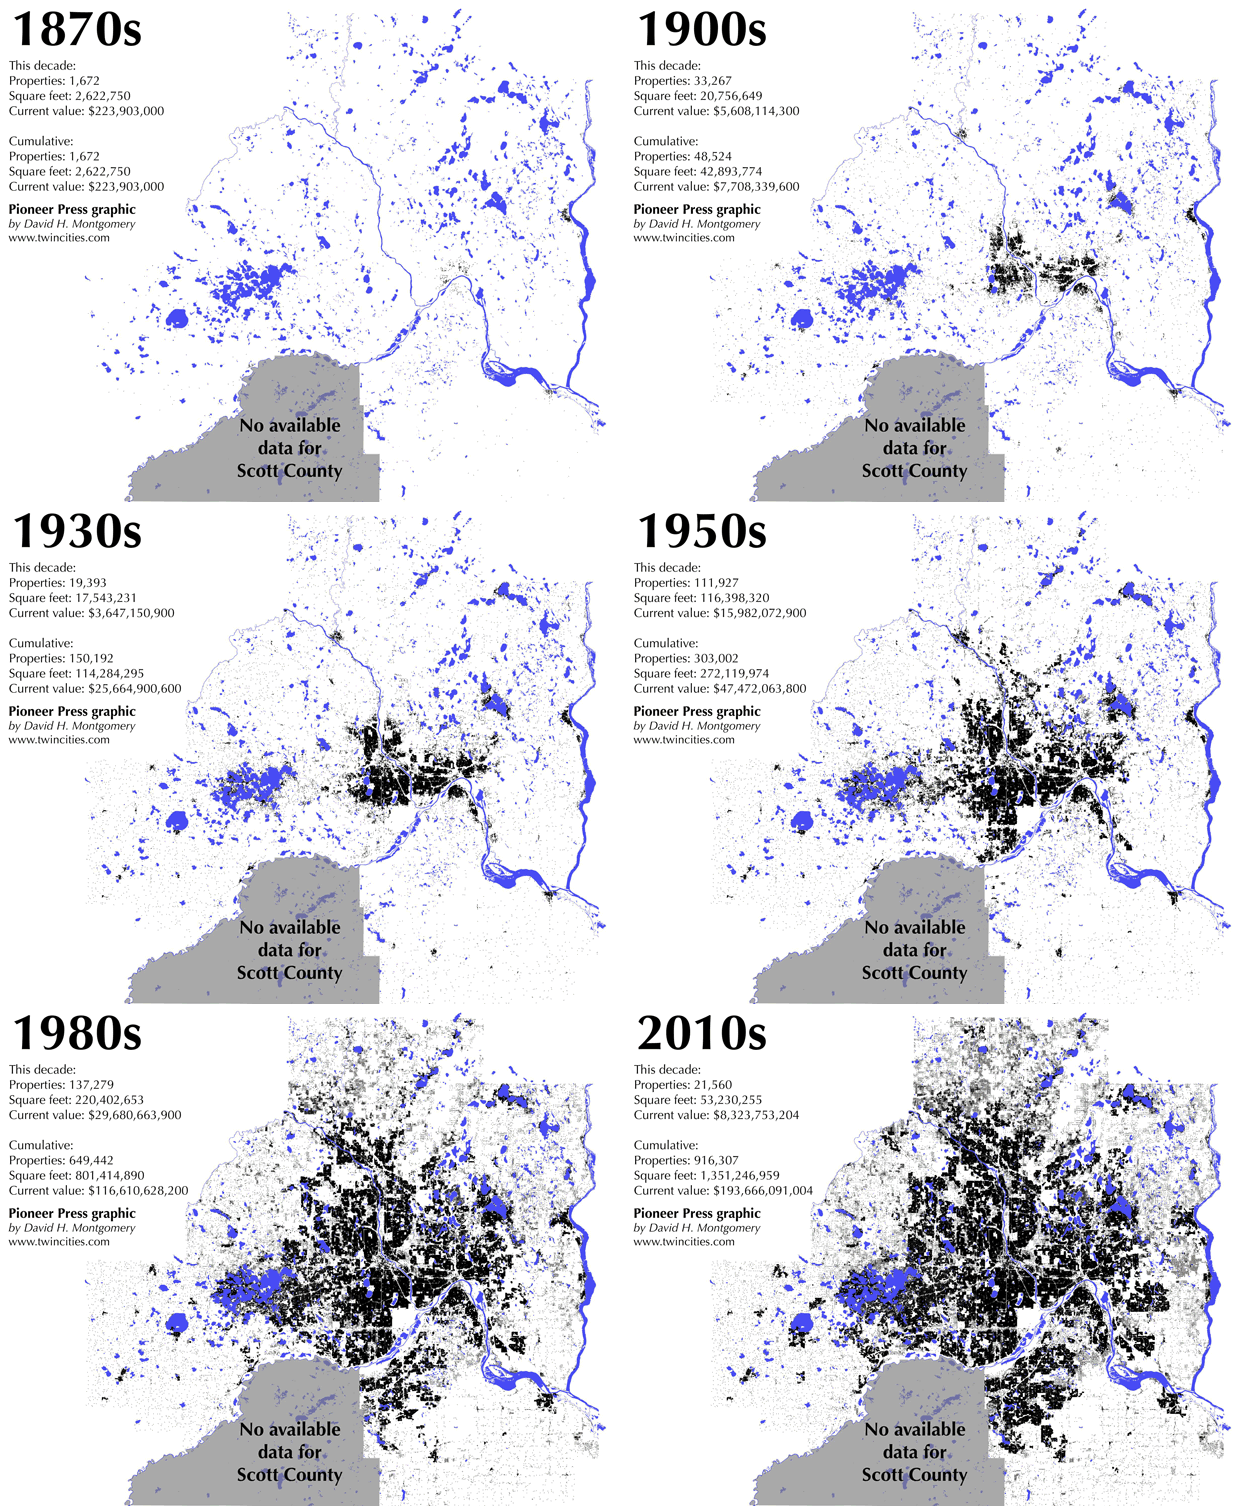
This animation shows the growth of the Minneapolis-St. Paul metro area by mapping most of the current buildings in the Twin Cities metro area by the decade in which they were constructed.
Though the maps reflect current buildings rather than contemporary maps of the Twin Cities each decade, Metropolitan Council staff said they’re largely reflective of the area’s growth over the past 150 years.
Early development in the region was based on four centers: Hastings, St. Anthony-Minneapolis, St. Paul and Stillwater.
By 1900, Minneapolis and St. Paul had grown to dominate the area. The two would merge into a single urban area by 1940, as growth to the west of the metro area around Lake Minnetonka also blossomed.
Huge growth started after World War II, when new roads and widespread car ownership provided access to far-flung stretches of land.
The data comes from the MetroGIS Regional Parcel Dataset of every building in the metro area, provided by counties. Scott County, unlike the other six metro-area counties, does not release this data for free, public download. Some buildings don’t have data on construction date and so were not included.
Because each building is represented by a single dot regardless of its size, areas with large buildings or big yards will appear less dense than areas with many small buildings next to each other.
For a combination of these reasons, the downtown areas of Minneapolis and St. Paul appear empty for much of this period, though they were in fact heavily built out from the start.
Statistics on properties, square footage and values should be taken as approximate due to the data issues noted above. (Pioneer Press 08/08/2015)
