American latitude
More than 320 million Americans live in the lower 48 states. But as anyone who’s ever traveled through the vast empty expanses of the western United States knows, not all parts of the country are populated evenly.
To visualize this population breakdown, I calculated the approximate number of Americans living in every degree of latitude and longitude in the Lower 48.
Overview
The contiguous lower 48 U.S. states run roughly from the 25th parallel (the southern tip of Florida) to the 49th parallel (the northern borders of Washington, Montana, North Dakota and Minnesota — minus the Northwest Angle), and from the 67th meridian (the tip of Maine) to the 125th meridian (just past Washington’s Olympic Peninsula).
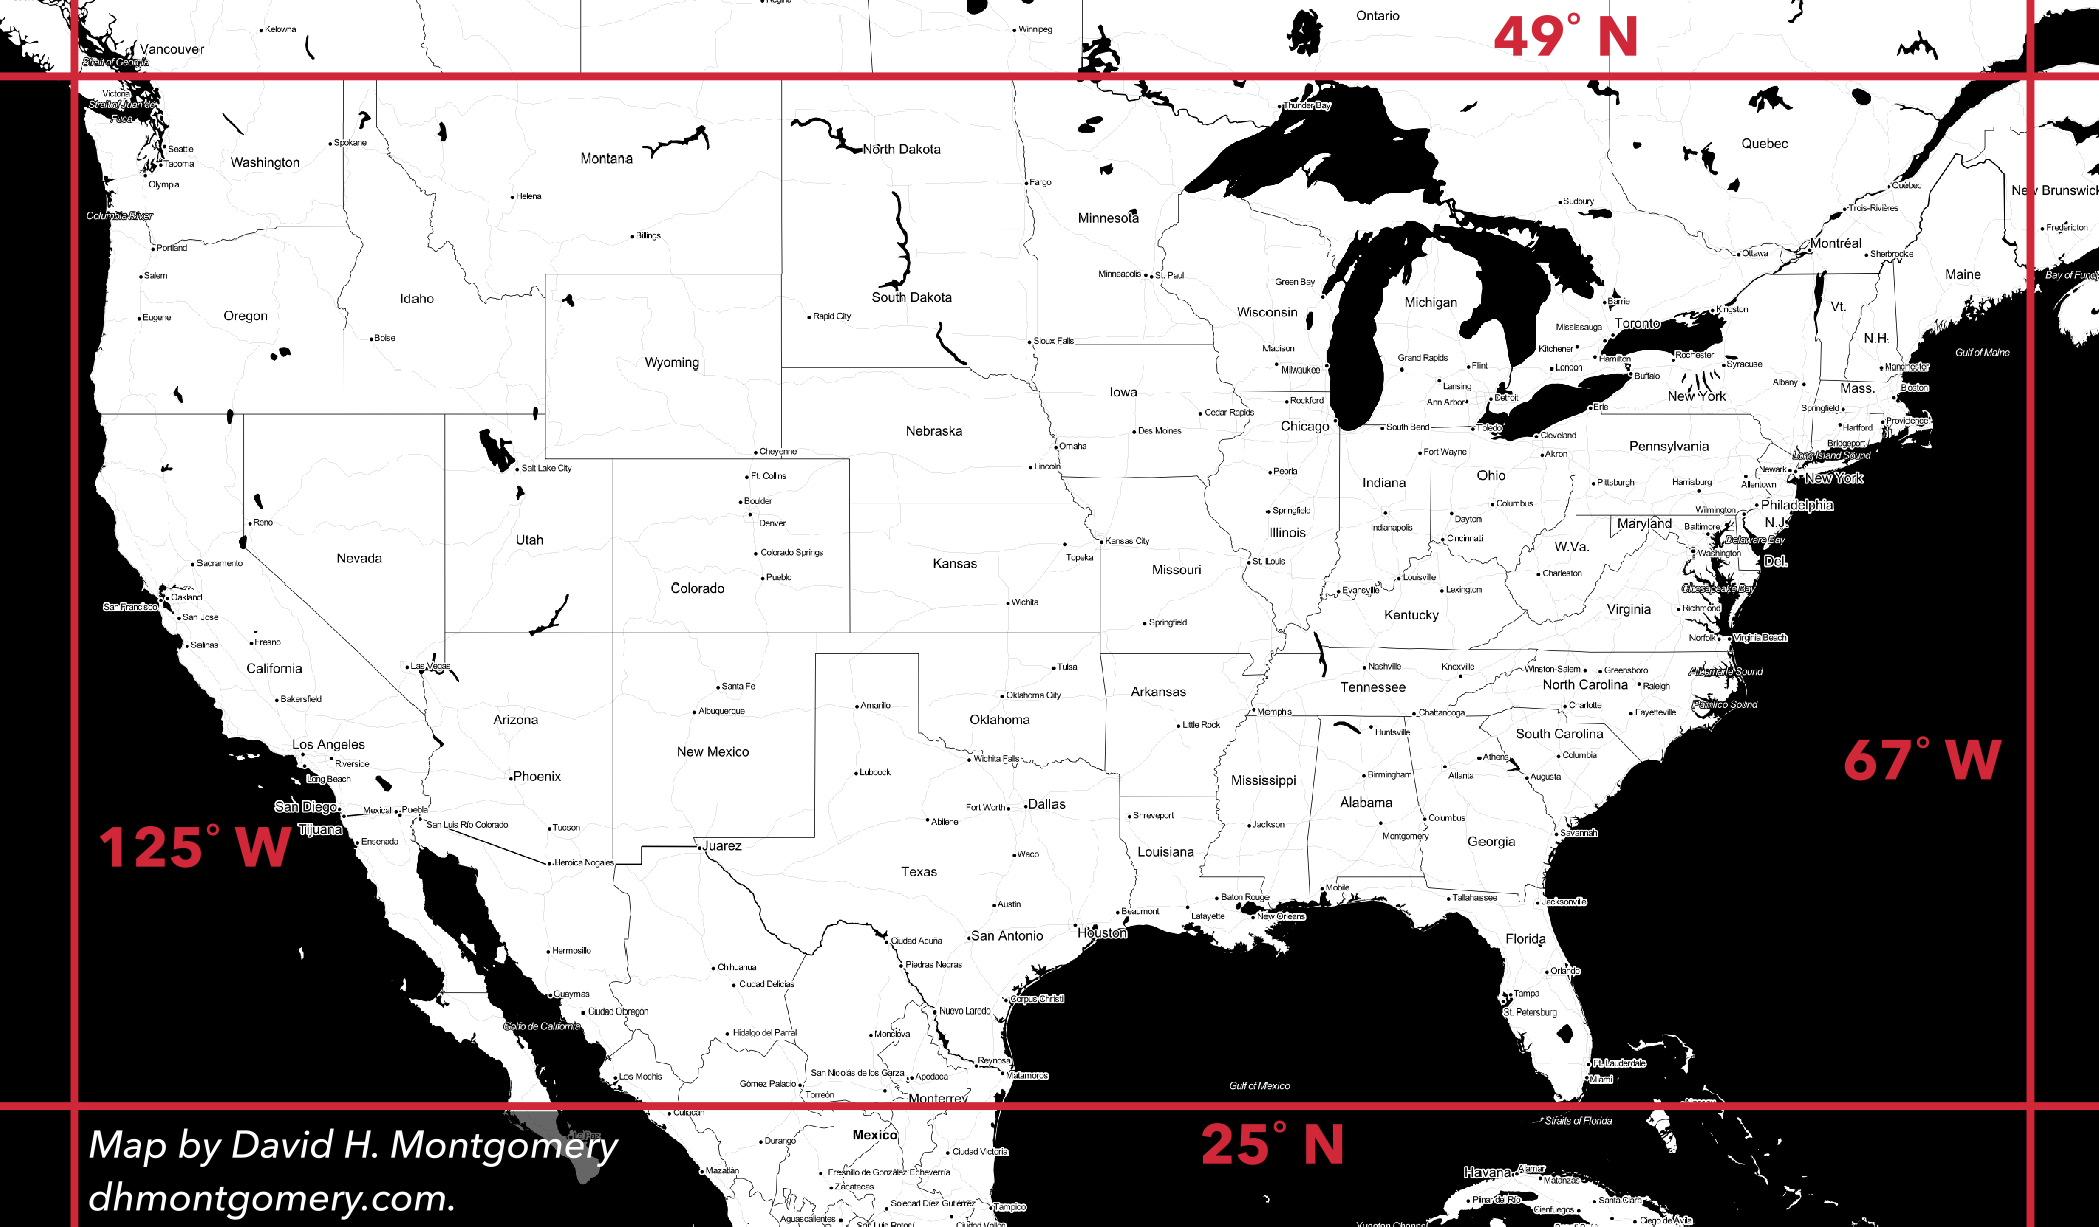
Over these 25 degrees of latitude and 59 degrees of longitude live around 320 million of the United States’ 323 million residents.
Population by longitude
Most Americans live in the eastern part of the country. The stretch from the 70th meridian to the 90th meridian — roughly from Boston to the Mississippi River — has 29 percent of the country’s area but 59 percent of the population.
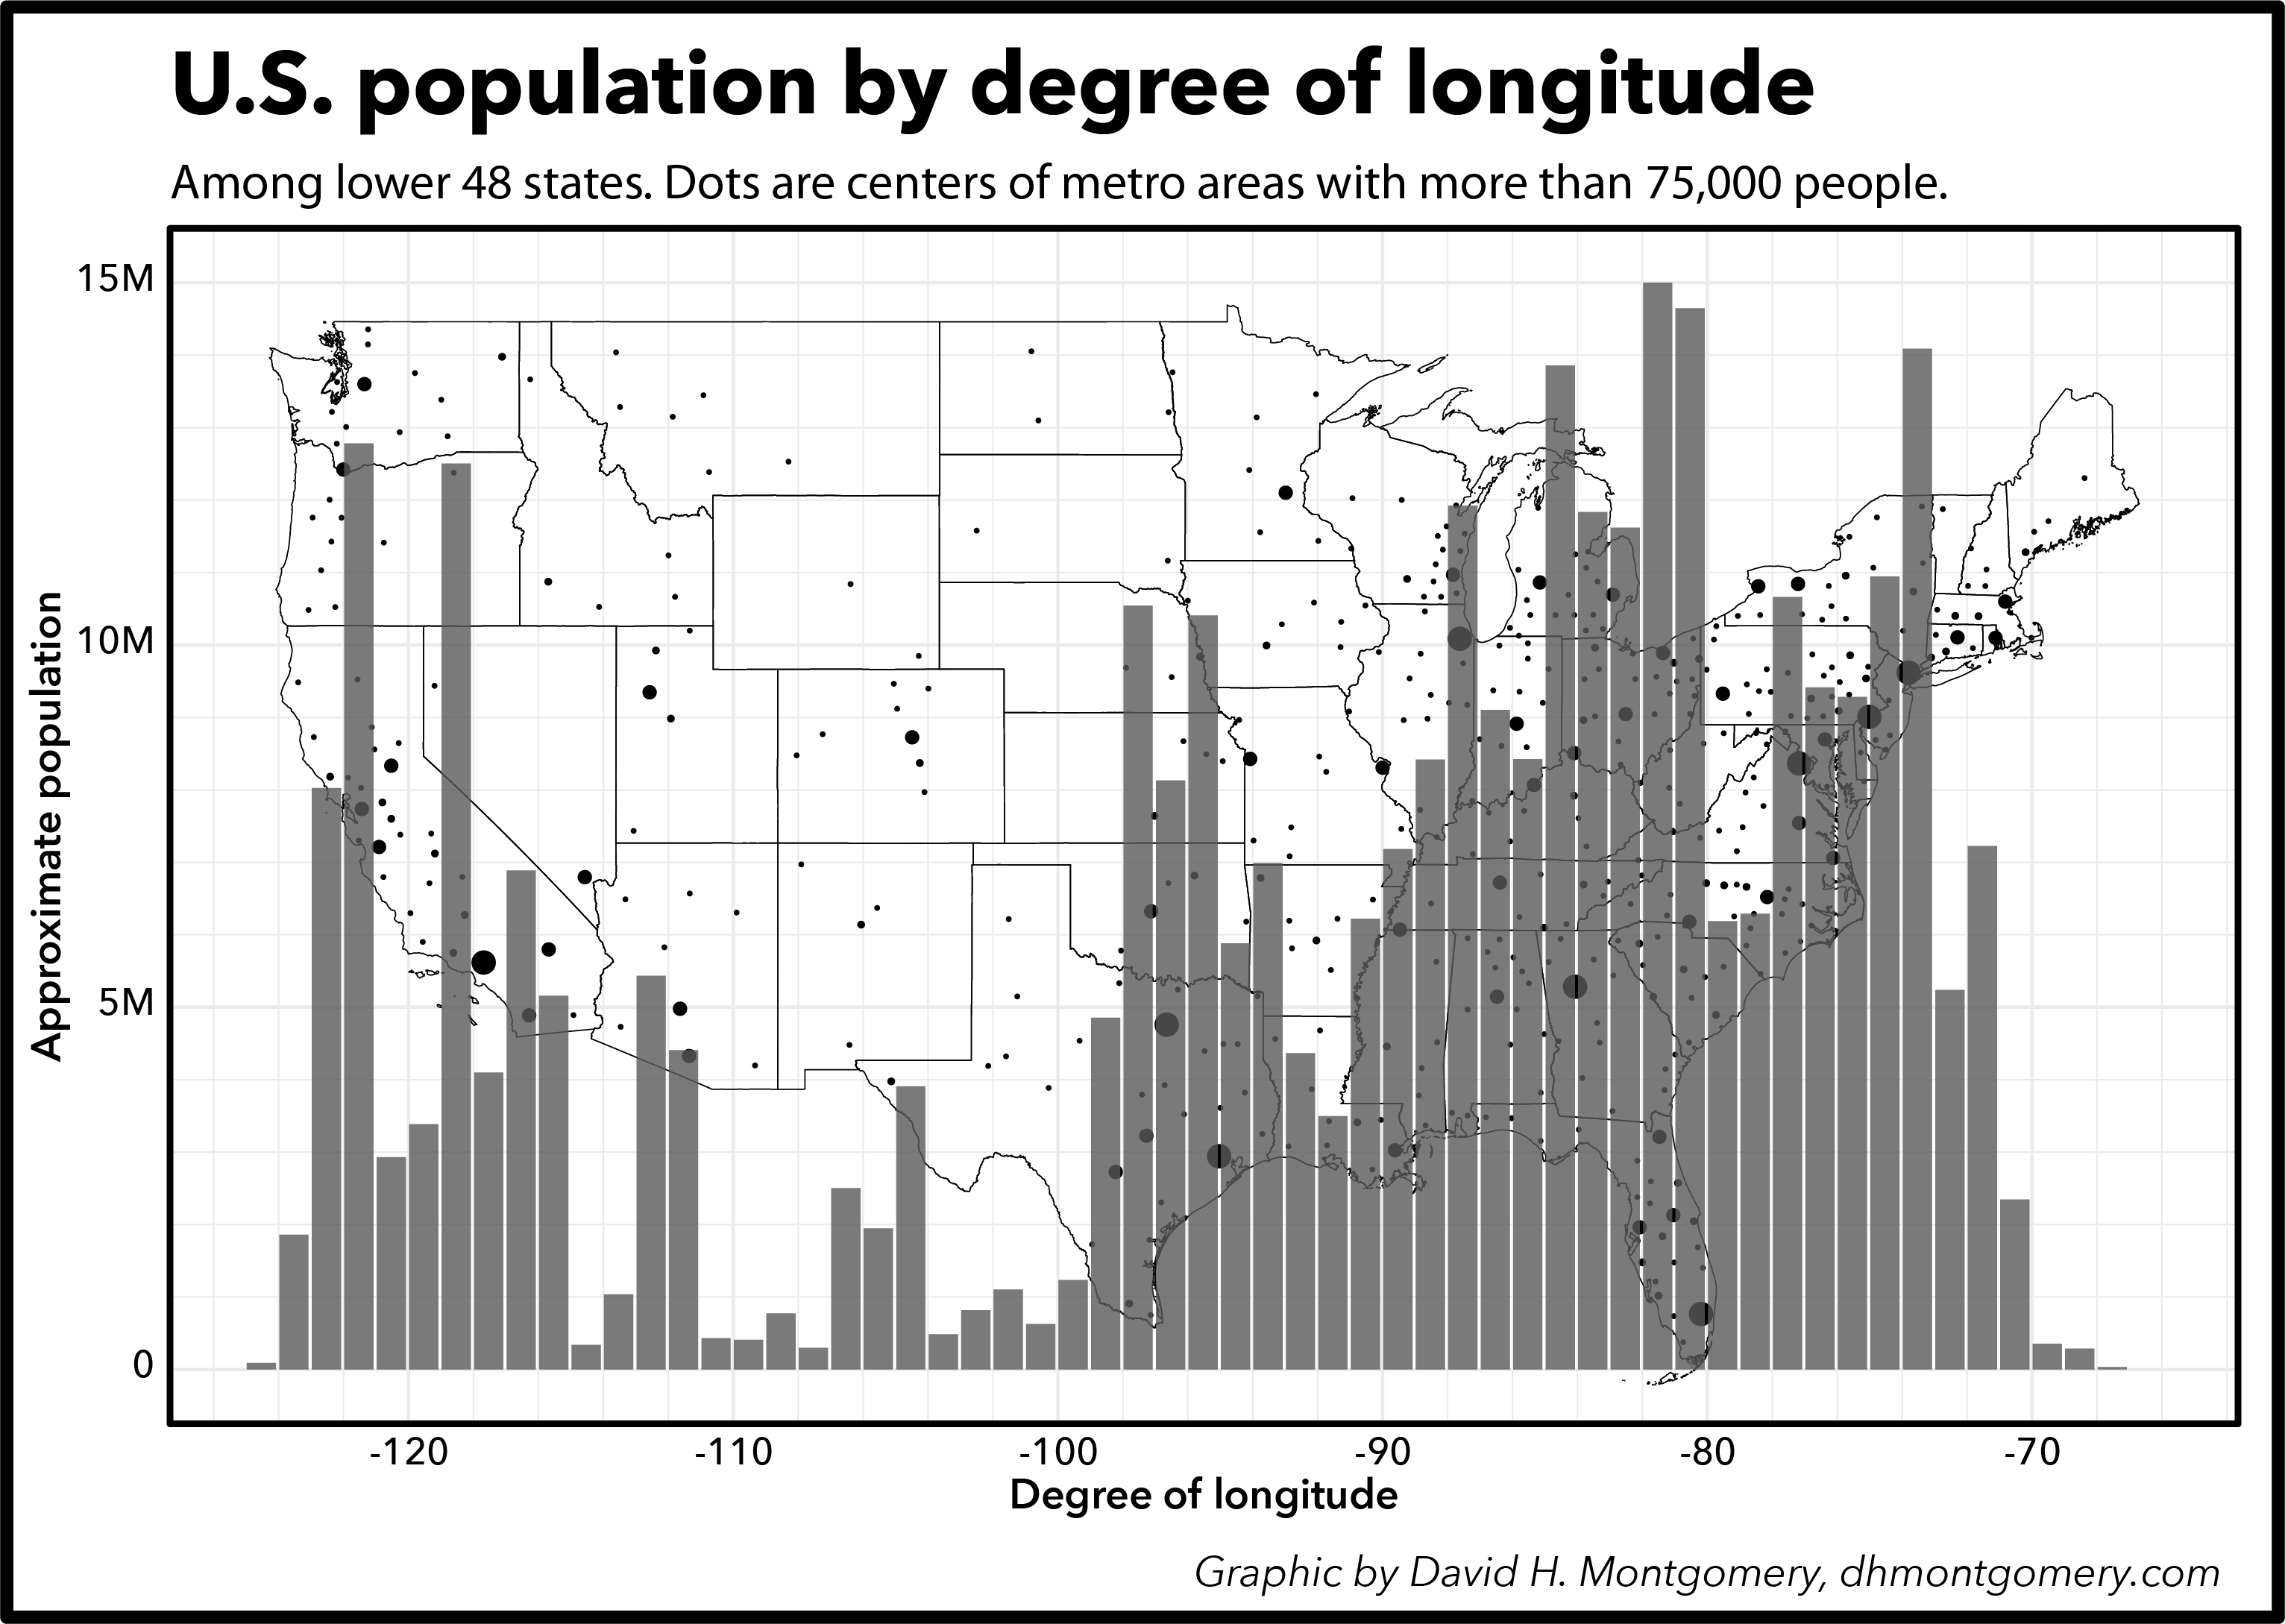
Most the rest of the population lives in two other north-south bands. The area between the 90th and 98th meridians — from the Mississippi to the middle of Texas — includes Houston, Dallas, San Antonio, Minneapolis-St. Paul, Omaha and Kansas City. It has 16 percent of the Lower 48’s population, though in 20 percent of its land.
A far western strip from the 115th meridian to the Pacific Ocean has 17 percent of the population, living in 15 percent of the area. This includes basically all of California, Washington, Oregon and Nevada — some densely populated areas and some huge wastelands. The longitude bands corresponding to Los Angeles (118˚ W) and San Francisco, Portland and Seattle (122˚ W) are particularly populated.
In between those two is vast expanse where settlements are rare. This area has 36 percent of the country’s area but just 8 percent of its population. This Interior West has a few big cities such as Phoenix and Denver, but overall doesn’t compare to the rest of the country.
Interestingly, though the 100th meridian is often thought of as the climatological division between east and west (east of here gets enough rain to grow crops without agriculture, while west does not not), the demographic cutoff happens further east, at the 98th meridian. (The 98th meridian is where 20th Century historian Walter Prescott Webb placed the start of the Great Plains.)
Population by latitude
The most densely populated band of the country runs between the 39th and 42nd parallels. This includes New York City, Boston, Philadelphia, Chicago, Denver and Cleveland, among other cities. Overall this continent-wide swathe has 23 percent of the Lower 48’s land area but 34.7 percent of its population.
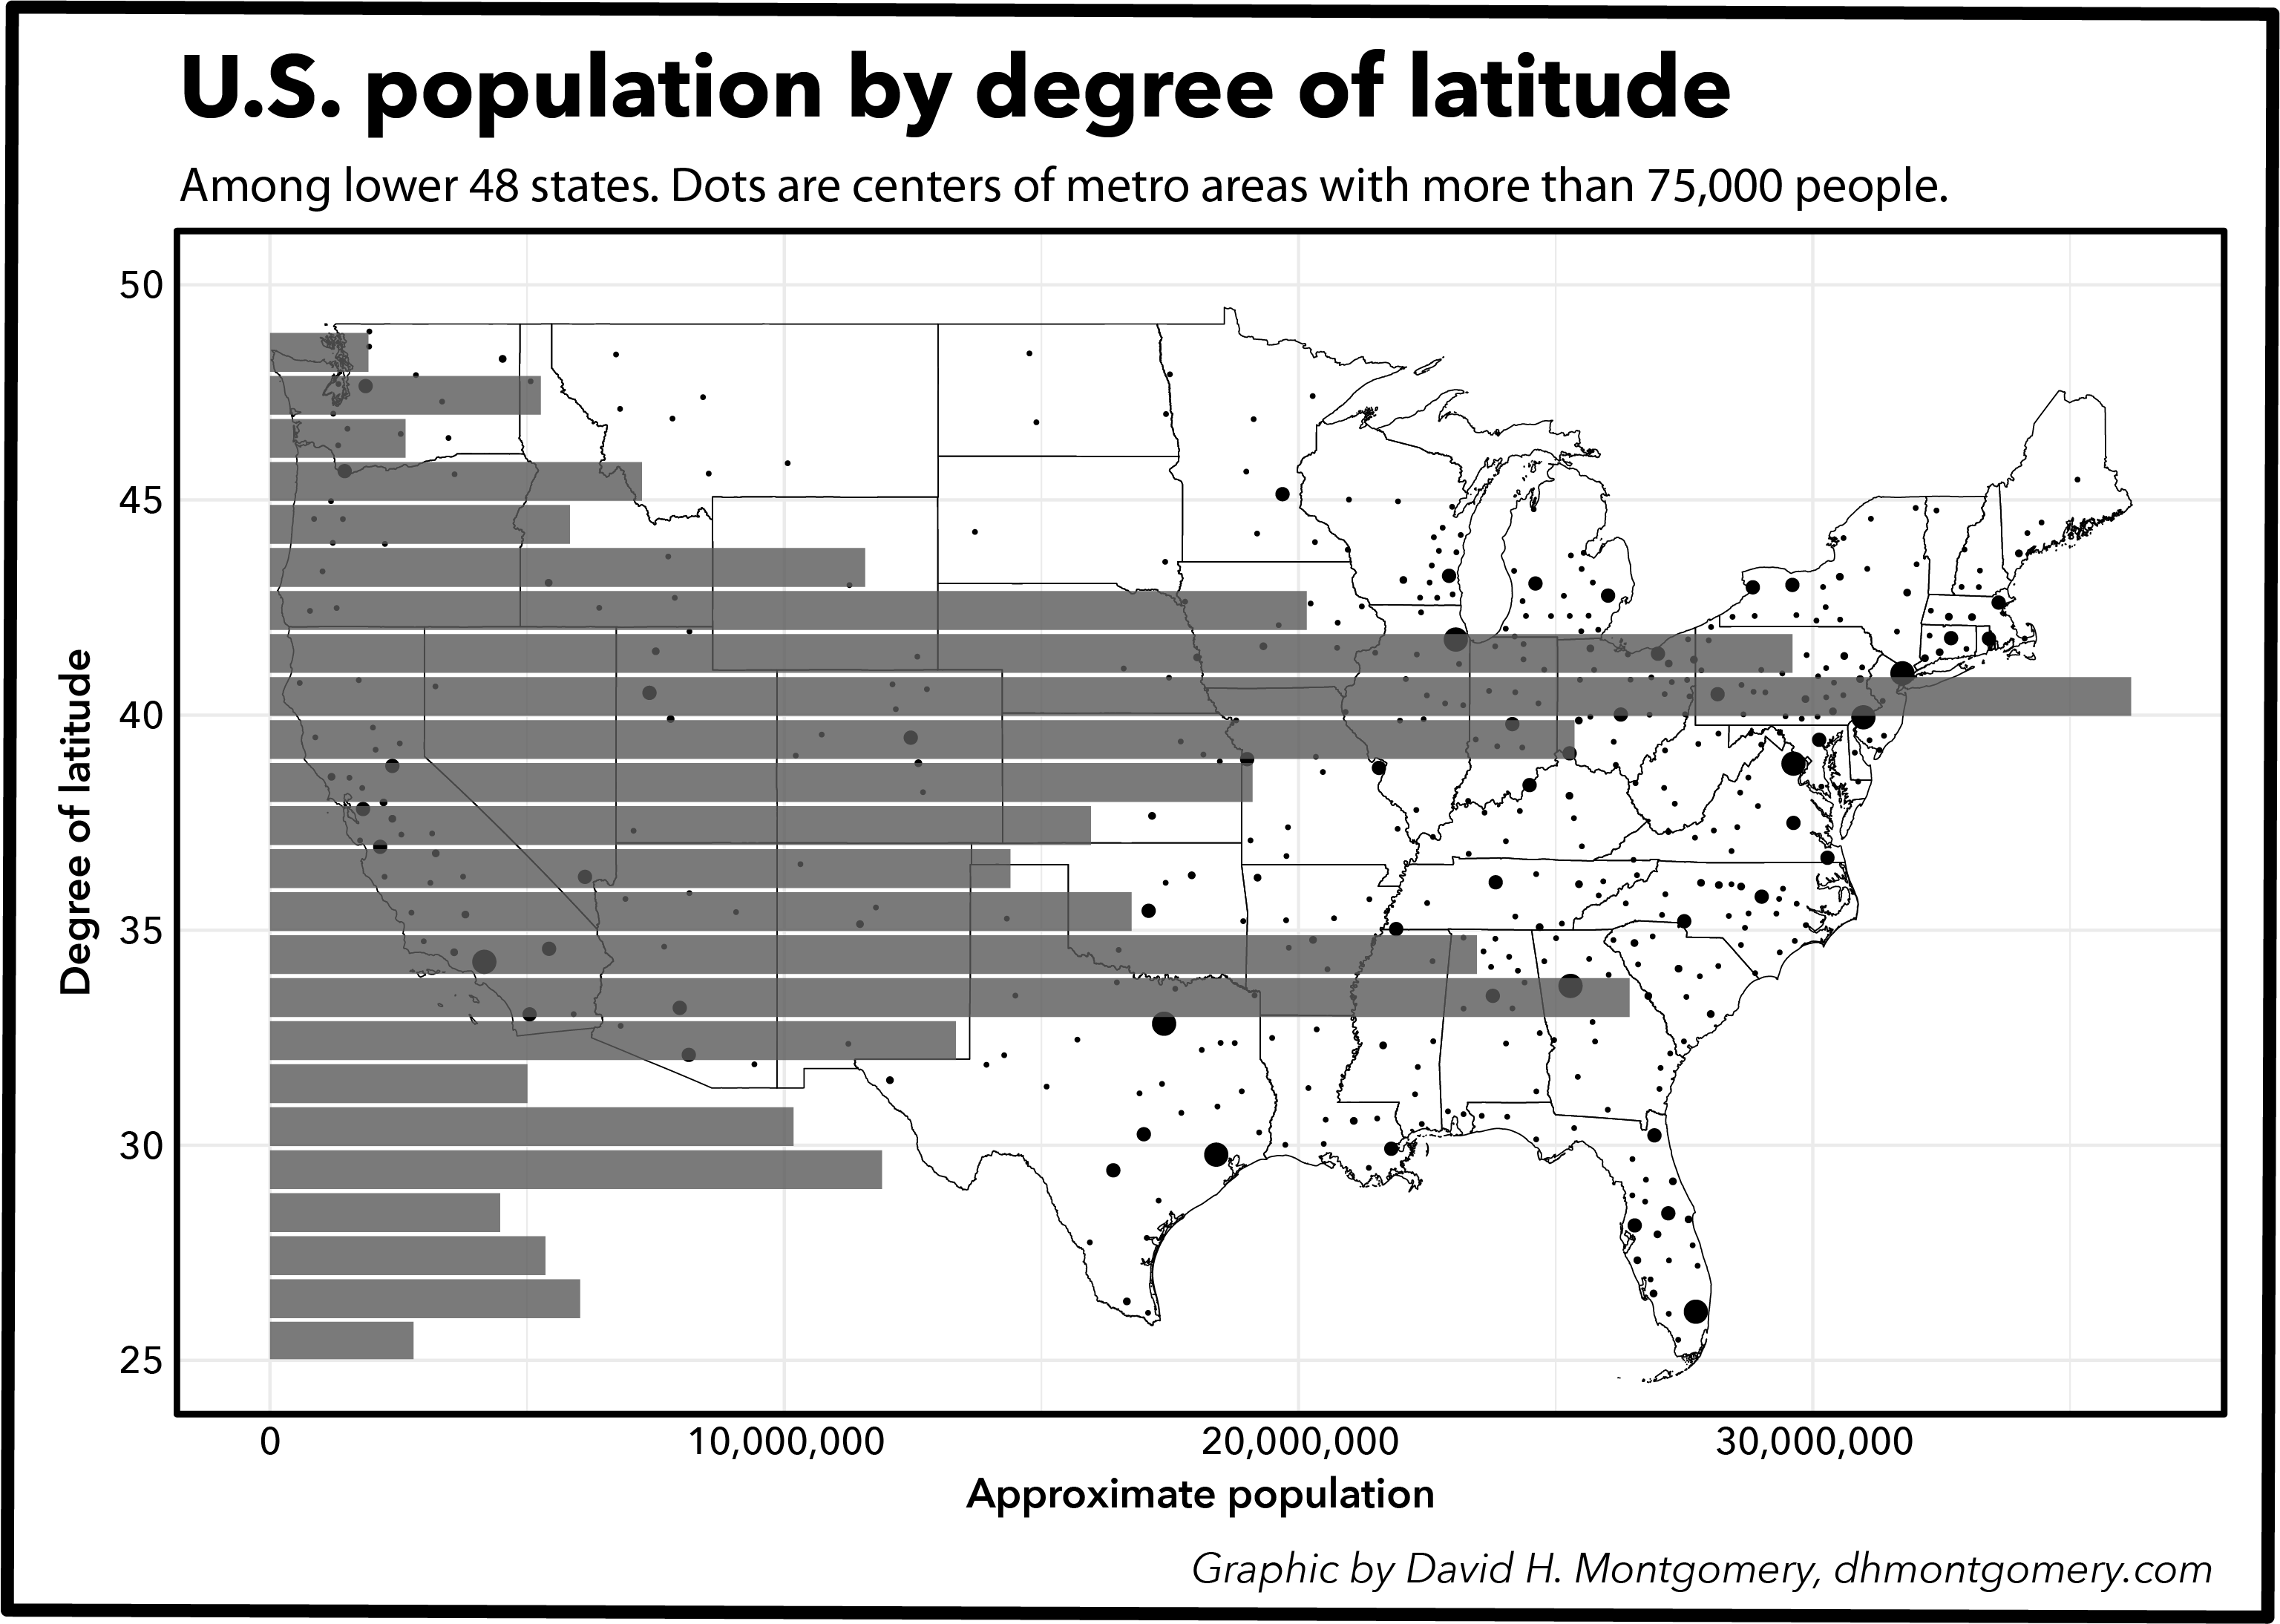
Also densely populated is a southern stretch between 32˚ N and 35˚ N. That includes Los Angeles, Dallas, Atlanta, San Diego and Phoenix: 15.4 percent of the land area but 19.7 percent of the population.
In between is a more desolate band. Despite some big cities, such as Washington, D.C., San Francisco and St. Louis, this area is underrepresented compared to its area. It makes up 23.4 percent of the land area but just 20.6 percent of the population.
The southern extreme of the country doesn’t have a lot of people — but it also doesn’t have a lot of land. The area below the 32nd parallel includes the southern part of Texas, the Gulf Coast and Florida, but large swathes of this east-west distance is covered by water or Mexico. Big cities there include Houston, Miami, Tampa, San Antonio and New Orleans; it has just 10.6 percent of the Lower 48’s land but 14.2 percent of its people.
Most desolate of all is the country’s northern reaches. The area north of the 43rd parallel has 26.6 percent of the land area but 10.7 percent of its people. In the east this is Vermont, New Hampshire, Maine and upstate New York; in the west it has Seattle, Minneapolis-St. Paul, and very few people in between.
Combine these two maps and we get a picture of the most desolate part of the country being the northern stretches of the interior west. Indeed, a recent analysis by the Washington Post identified this part of the country as the true “middle of nowhere” for the Lower 48:

Population density
We can also look not at raw population, but at population density. After all, while America’s population drops off sharply below the 32nd parallel and above the 43rd parallel, so too does America’s land:
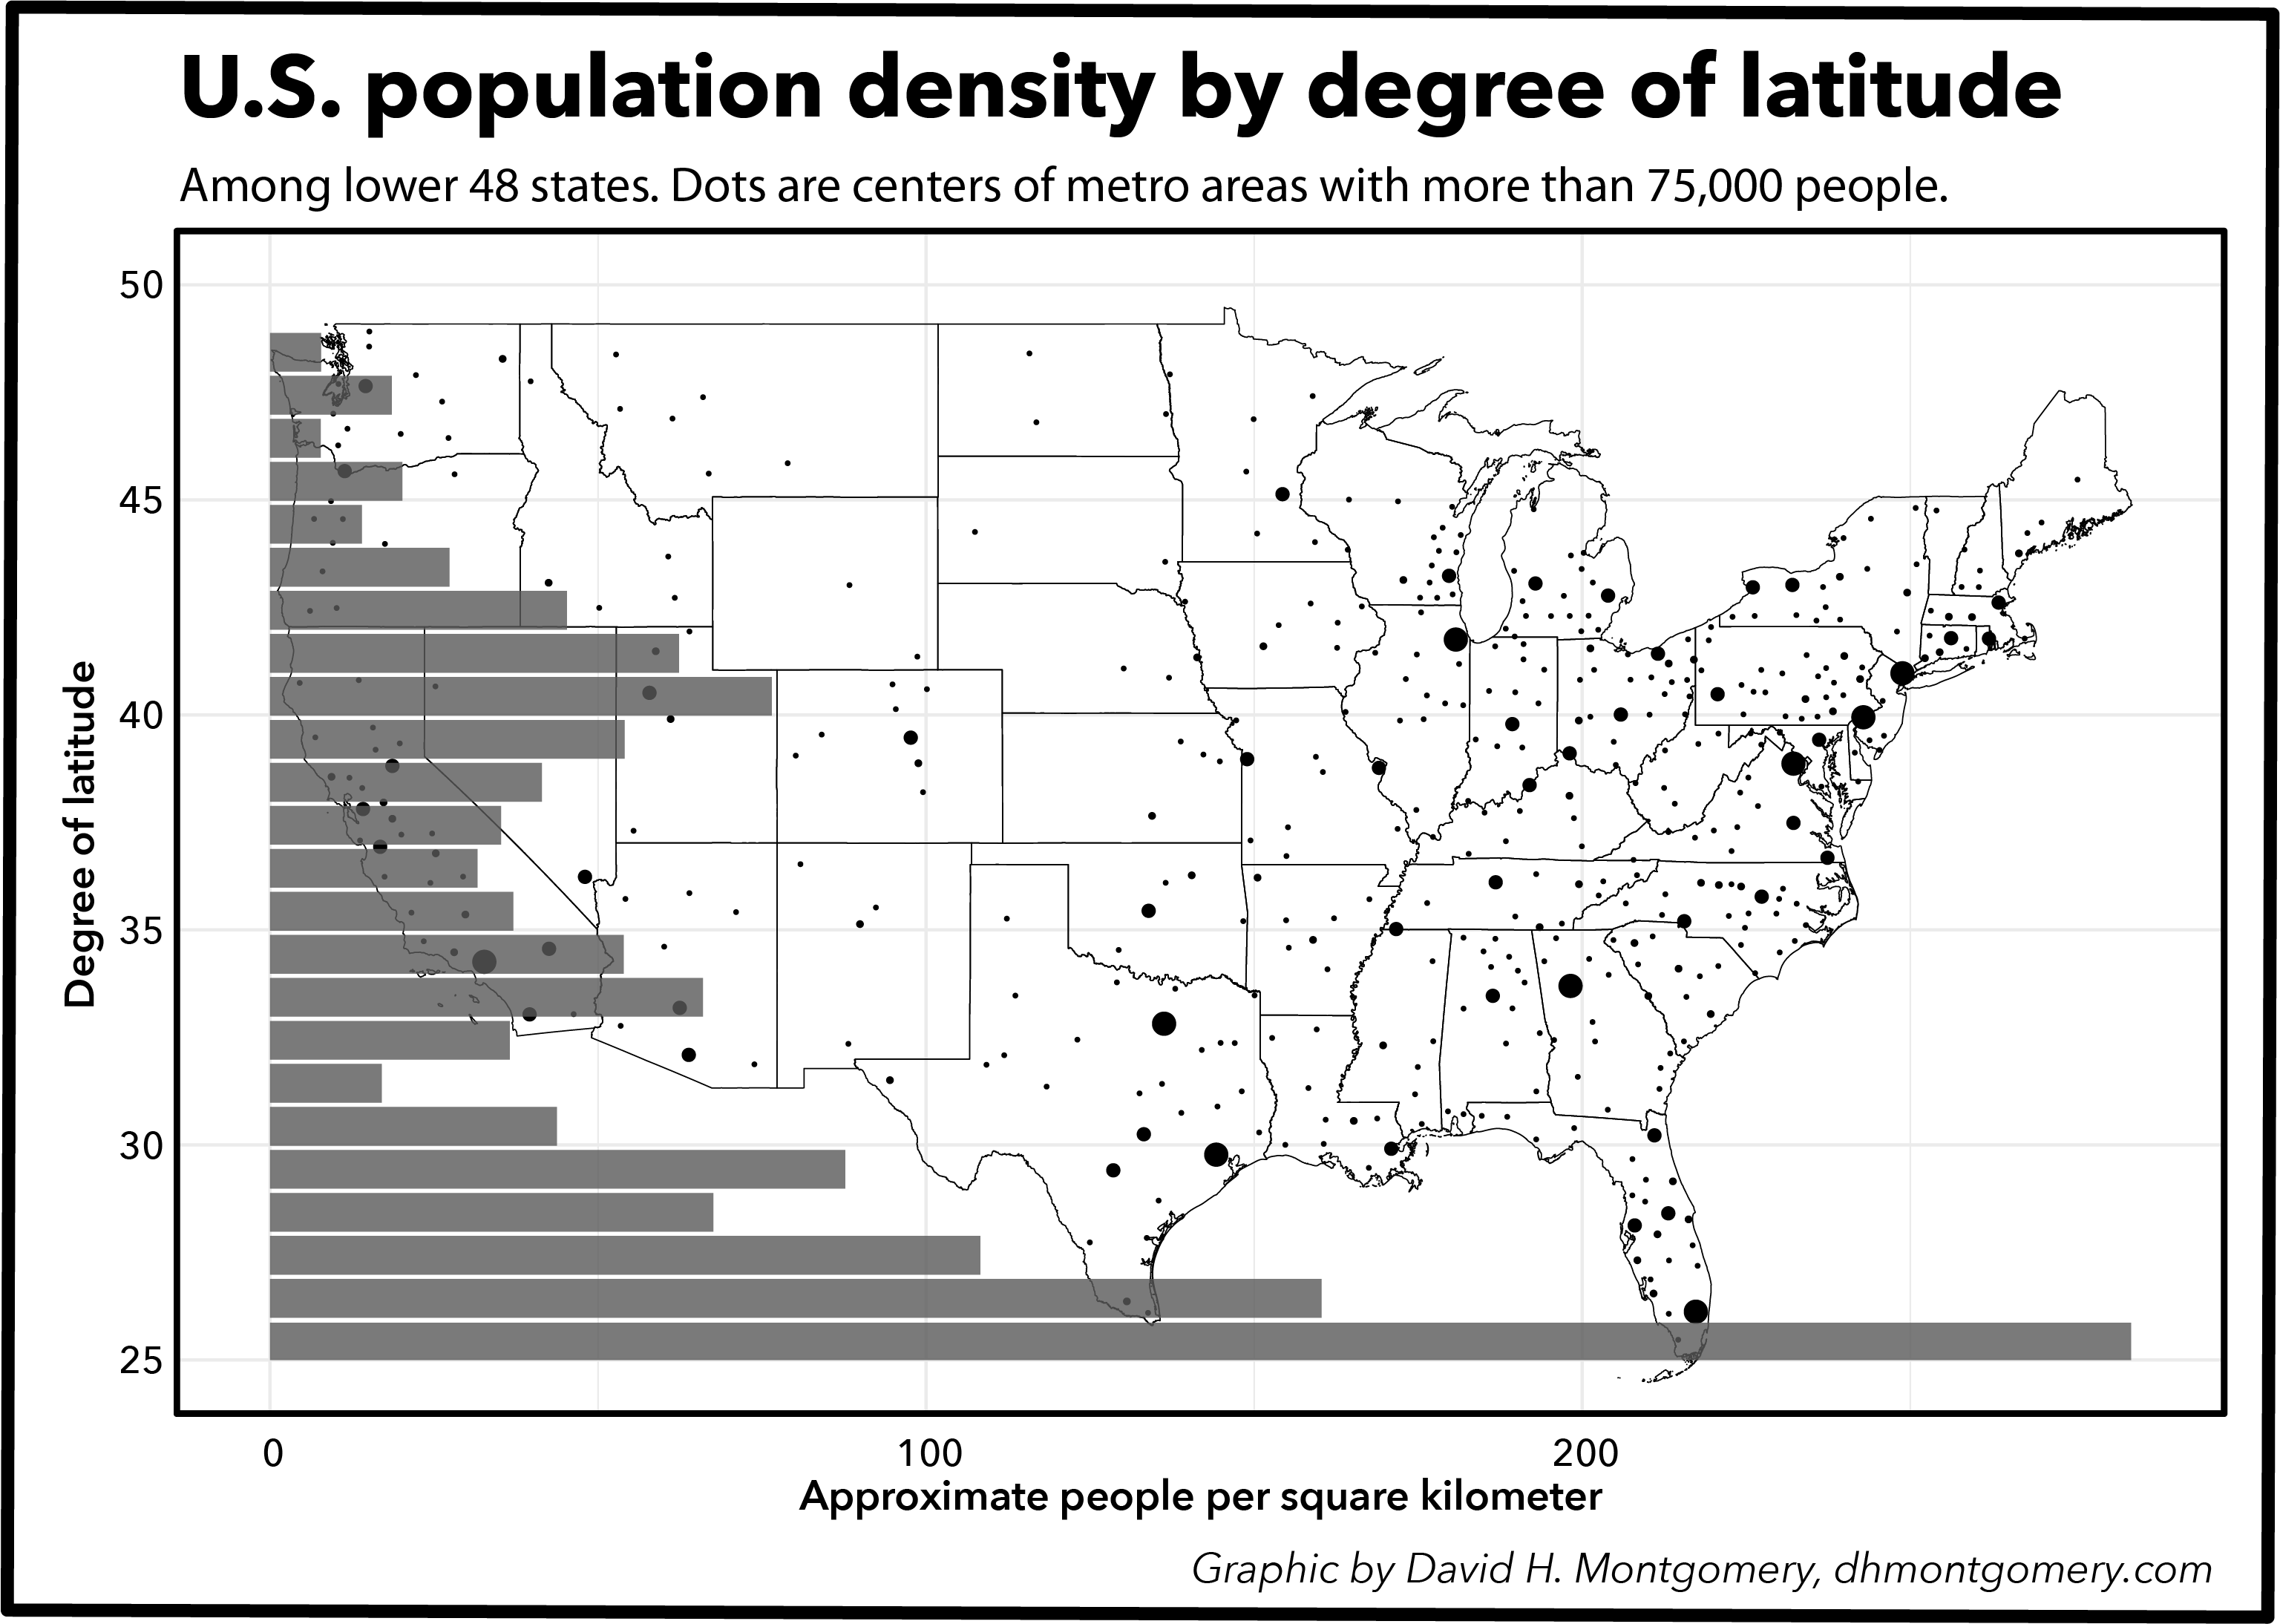
This gives us some insights compared to the base population map — we still see the two peaks between the 39th and 43rd parallels and the 32nd and 35th parallels, but they’re less prevalent since these latitudes have both massive cities and massive stretches of rural areas. But this density map is distorted by Miami’s 25th parallel, which has a huge city and almost no land. (That said, this densest American latitude, with around 283 people per square kilometer, is less dense than many entire countries, such as the Netherlands, Israel, Japan and the Philippines.
The map of population density by longitude shows an even more extreme situation, as New York City and the Hudson Valley has tons of people in a relatively small area. (This 73rd meridian has about 370 people per square kilometer, or about the same as Belgium.)
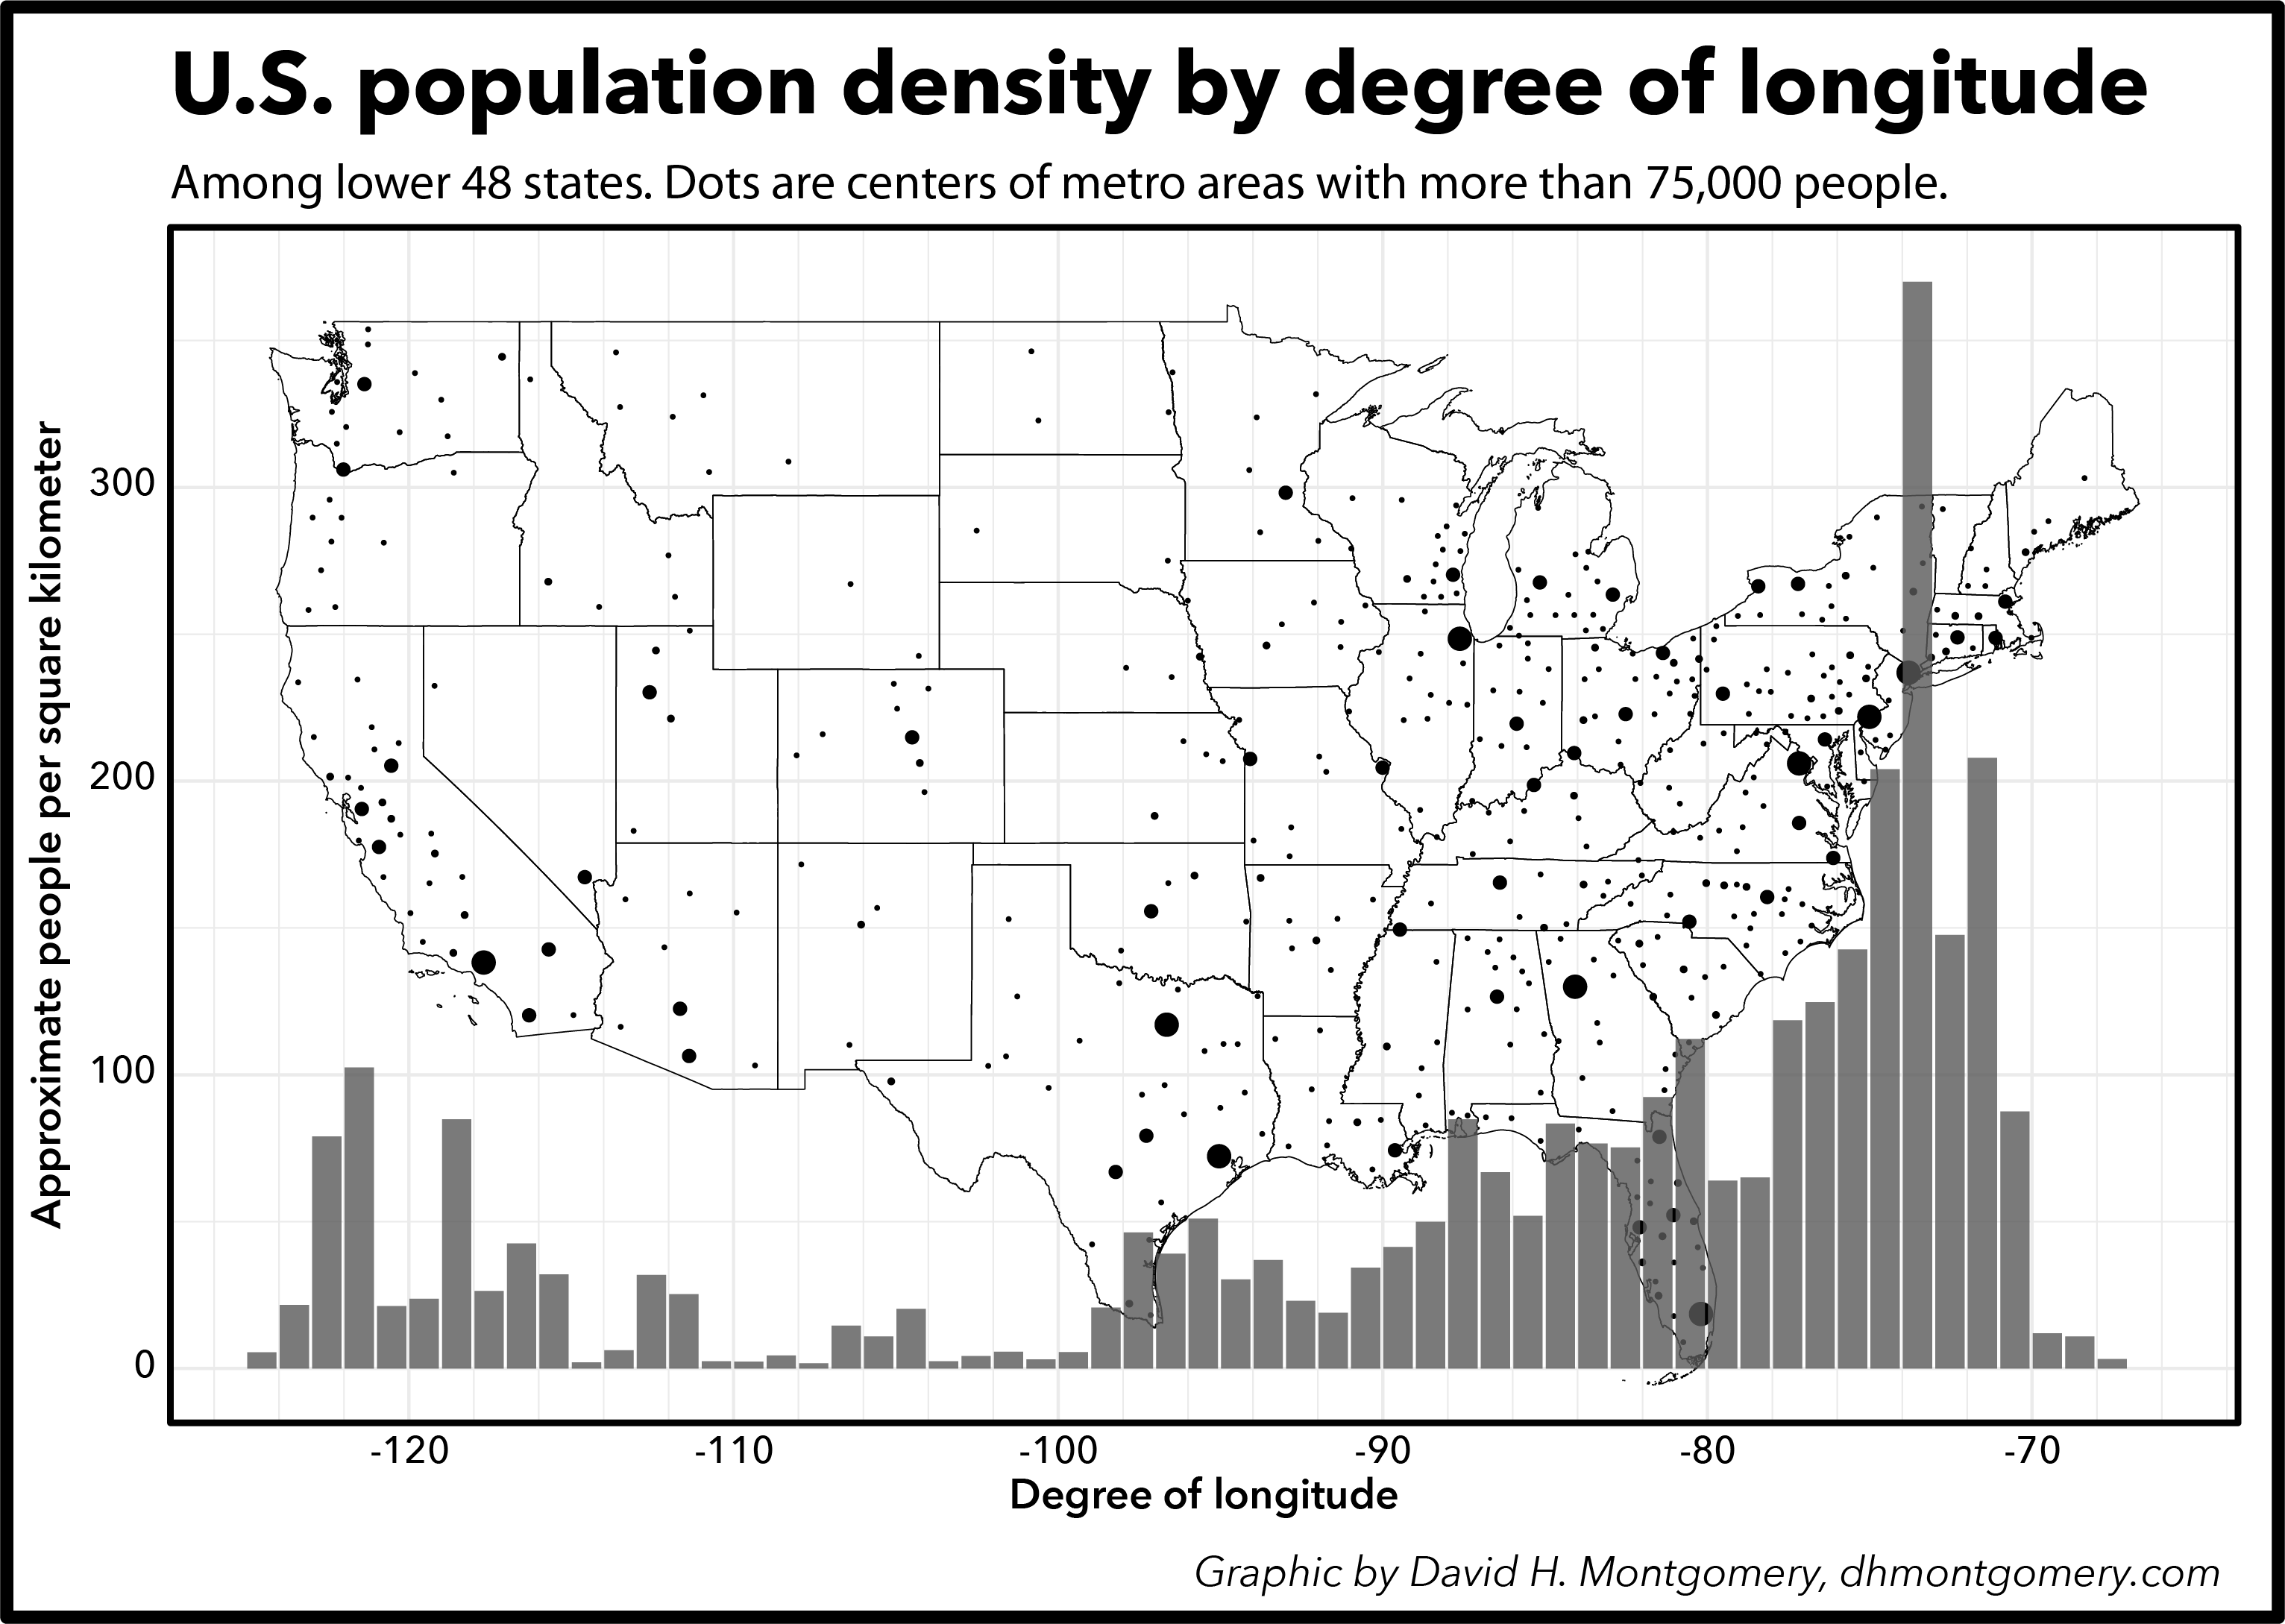
Parts of the country between the Appalachians and the Mississippi have lots of people, as we saw on the population by longitude map, but they’re considerably less dense than the eastern seaboard.
(It’s worth noting that what qualifies as “remote” or “sparsely populated” in the Lower 48 can seem downright urban by other standards — such as the Canadian province of Labrador, where the government will loan travelers satellite phones in case they have car troubles in the middle of a 327-mile stretch between settlements of any size.)
Big picture
We can combine latitude and longitude into an approximate grid showing the population for every latitude-longitude combination in the country:
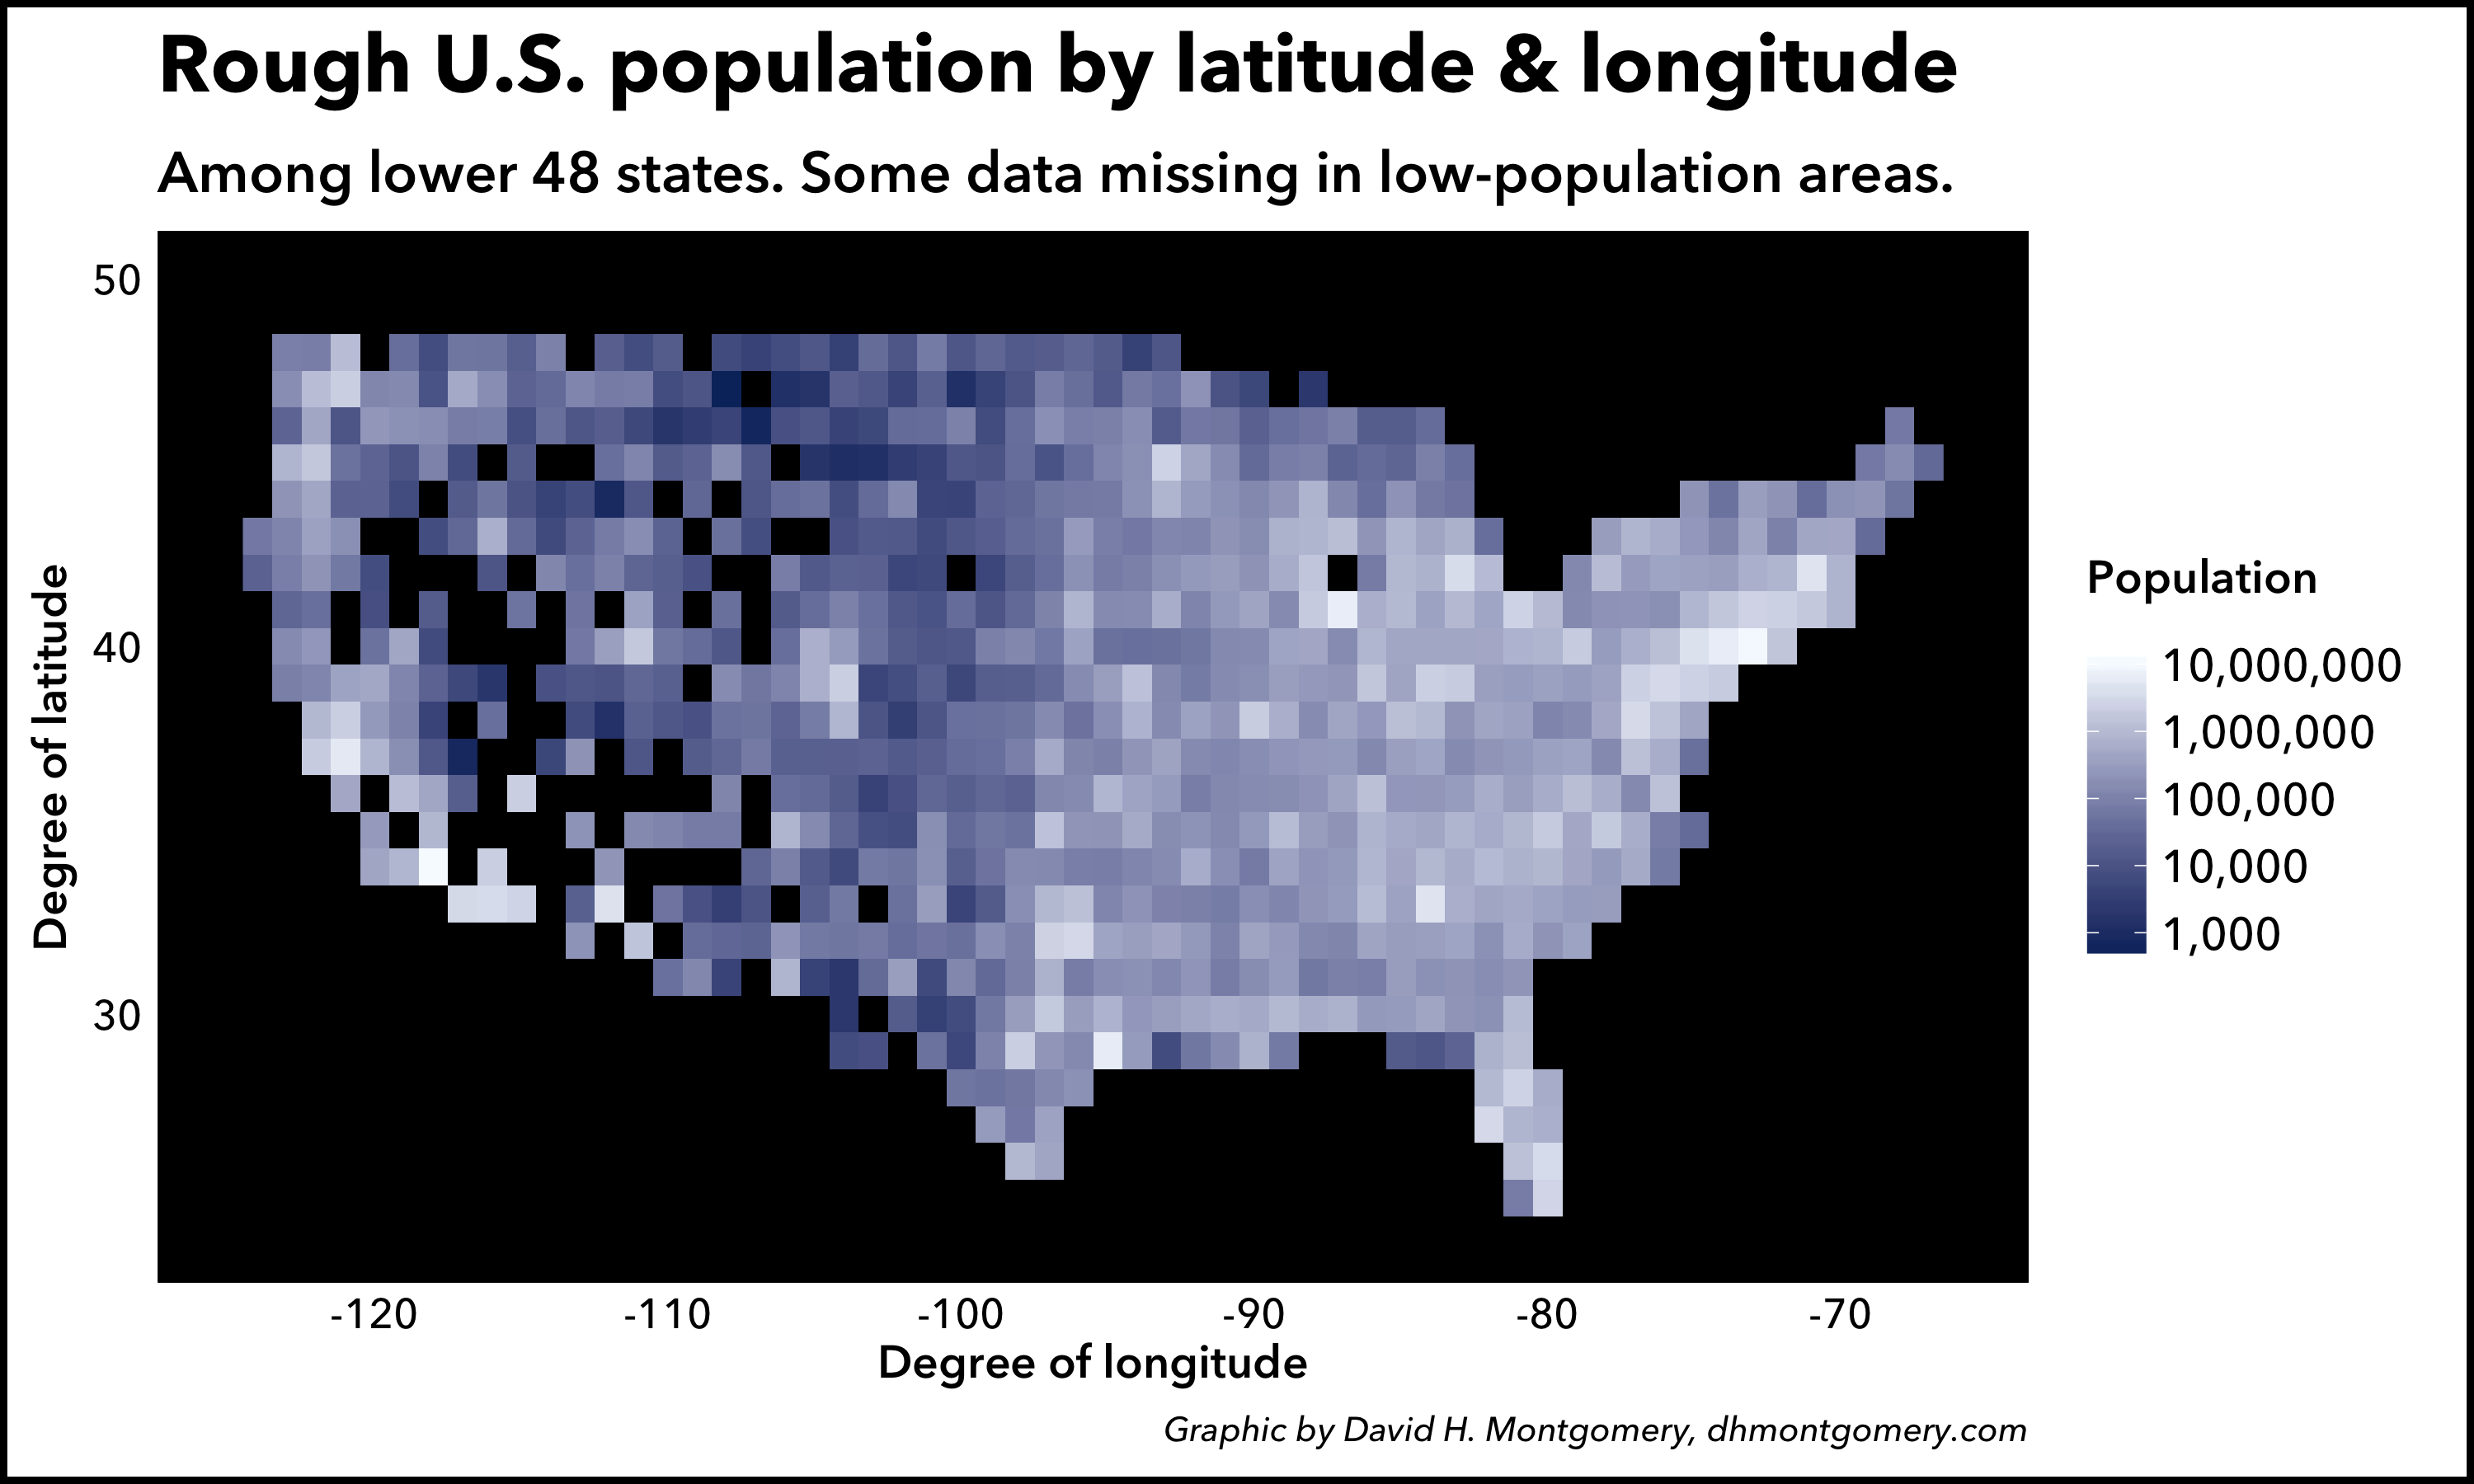
Note that some data is missing, especially in the west, because of the rough way in which I estimated population. (See below.)
Methodology
These population calculations were a little bit rough. I worked off county populations from the U.S. Census, and assigned each county to band of latitude and longitude based on where its geographic center was. That means that where populous counties sprawl over a line of latitude or longitude — such as Chicago’s Cook County, which sits on both sides of the 42nd parallel — they’re assigned to a single band. A majority of Cook County, for example, lies south of the 42nd parallel, so its 5.2 million people were assigned to the 41st degree band.
This also explains the missing tiles in the grid view above. If a particular latitude-longitude pair had no county geographic center in it, then it recorded no population living there. Using a more granular geography, such as Census Tracts, could solve this issue as well as improve overall accuracy.
Using the open-source GIS software QGIS, I divided sliced a map of the lower 48 states into bands based on latitude and longitude, calculated the area for each one, then divided that band’s population by its area in square kilometers to get a population density.
The metro areas dots reflect the geographic center of each U.S. Census Metropolitan Statistical Area with at least 75,000 residents.
- The smallest dots reflect metro areas with between 75,000 and 500,000 people (353 metro areas with a total population of 64.7 million people.
- The next size reflects the 53 metro areas with between 500,000 and 1 million residents — 37.8 million residents in all.
- There are 44 metros with between 1 million and 5 million residents, a total population of 100 million Americans.
- The 9 largest metro areas in the U.S. have more than 5 million residents each: Atlanta, Miami, Philadelphia, Washington, D.C., Houston, Dallas, Chicago, Los Angeles and New York City. They have a combined 81 million residents and are the largest dots on the map.
I made the graphs and maps using the ggplot package for the R programming language, and polished the project in Abode Illustrator.
You can access the shapefiles for the maps of the Lower 48 by latitude on longitude on Github. (I’ll add the code I used to create the graphs later.)